 Stay
Stay 
Trading Conditions
Products
Tools


Trend analysis (Fig. 1).
On Friday, the price after breaking through the pullback level of 38.2% (1.2502 - the red dotted line) may continue to move up to the target of 1.2670 - the pullback level of 50% (red dashed line). The next level may occur pullbacks to bottom: 1.2560 (the upper fractal), 1.2649 (the upper boundary of the Bollinger bands).
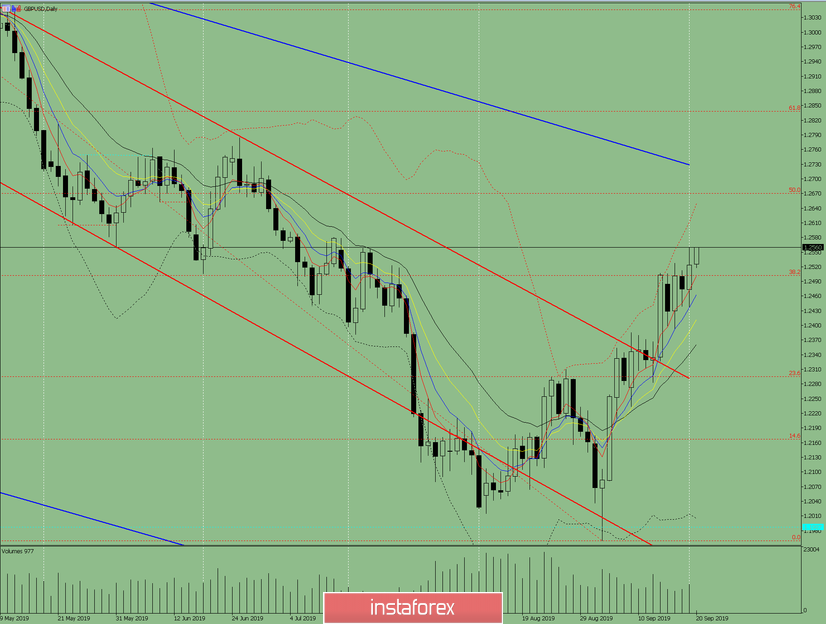
Fig. 1 (daily chart).
Comprehensive analysis:
- indicator analysis - up;
- Fibonacci levels - up;
- volumes - up;
- candlestick analysis - up;
- trend analysis - up;
- Bollinger Lines - up;
- weekly schedule - up.
General conclusion:
On Friday, the price will continue to move up.
An unlikely scenario is a downward movement, with the first target of 1.2438 - a lower fractal.
InstaForex analytical reviews will make you fully aware of market trends! Being an InstaForex client, you are provided with a large number of free services for efficient trading.


