Zůstat

The Hammer and Hanging Man paterny sú vytvorené v jední svíčce.
Hammer bol pomenován po kladivu protože tak vypadá. Objeví sa pri downtredne. Naopak pri Hanging Man, se zjeví pri stupajícim trendu.
Podobní jak Hammer je Takuri line.
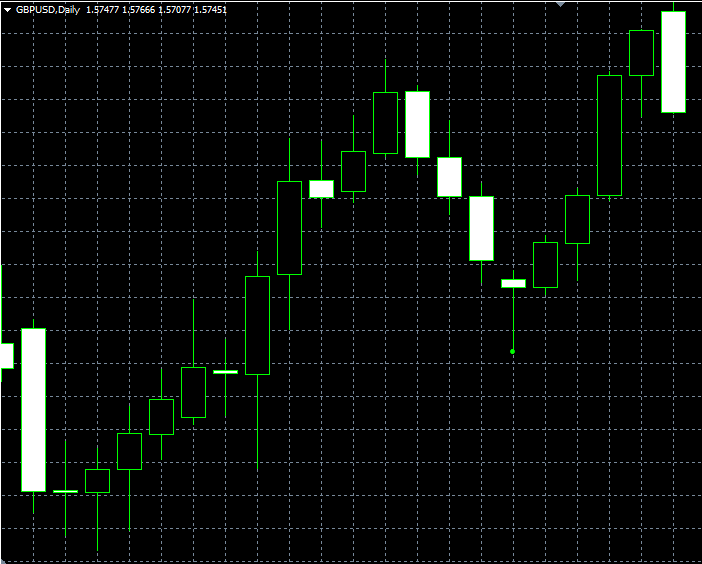
Jak rozeznát títo formace:
- the small real body is located by the upper end of the trading range;
- the color of the candlestick’s body is irrelevant;
- as a rule, the long lower shadow is two to three times longer than the real body;
- normally, the candlestick does not have any upper shadow. If it does, though, it is hardly visible.
If we look in detail at the Hammer pattern, we can see the following: the market is in a downward trend thus reflecting a certain bearishness. As the market opens, the price plunges rapidly. Then it starts to pick up, and the market finally approaches the session highs. If the closing price is higher than the market opening price, then the candlestick’s body is colored white. This situation tends to favor the bullish sentiment even more. It can be also confirmed by a higher opening price with an even higher closing price on the next trading day.
Speaking of the Hanging Man, the market is influenced by bulls because of the upward trend. In order for the Hanging Man to appear, the price must fall lower than where it opened. Then it should climb and then close near the highest marks. That is the moment when one can see a long lower shadow which shows how much the prices might decline. If the market opens lower the next day, then many traders who hold long positions would be looking for an opportunity to sell.
The features that enhance the signal coming from the Hammer or the Hanging Man are a rather long lower shadow, no upper shadow (almost Doji), and a strong previous trend as well as a body color that reflects the sentiment opposite to the previous trend. With all of these features combined, the Hammer changes into a Takuri candlestick. Takuri lines are usually much more bullish compared to the Hammer pattern.
The body color of the Hanging Man and the Hammer can convey a great deal of information. The Hanging Man pattern with a black body is more bearish than the one with a white body. Likewise, the Hammer pattern with a white body would be more bullish than the one whose body is colored black.
When the Hammer or the Hanging man appears, it is important to wait for some confirmation, which may simply be the action of the next day opening. However, it would be much better to wait for a confirming closure. If the Hammer appears, the price should close even higher on the following day. In this case, you can take a bullish position.
Worth noting that the Hammer and the Hanging man that are both made of just one candlestick cannot be divided any further.
As for related patterns, the Hammer and the Hanging Man are considered to be special cases of the so-called Dragonfly Doji. In most cases, it would be more bearish than the Hanging Man.
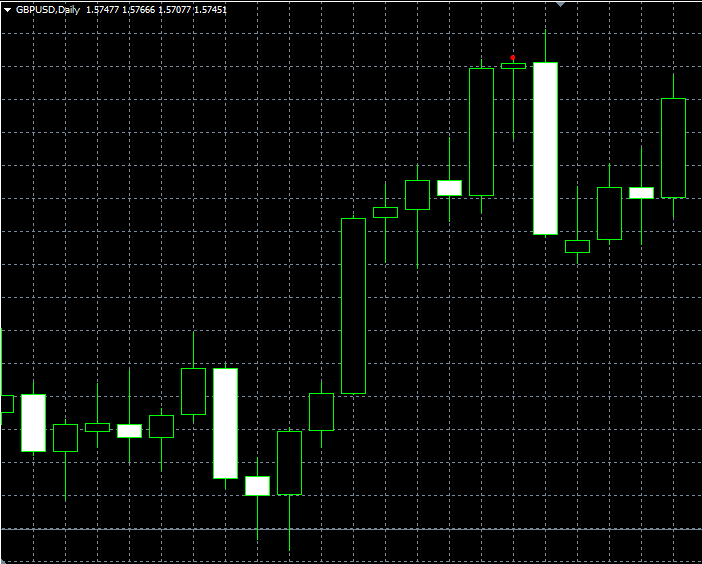
The Engulfing pattern consists of two real bodies of opposite colors. The body of the second day completely engulfs the body of the previous day. In this pattern, shadows are not to be taken into account. This candlestick is also called the Embracing line (daki). It fully embraces the previous day’s candlestick. If this pattern approaches the market top, it indicates a shift of the market sentiment to selling. After an upward trend, Yin Tsutsumi is called the Final Daki and becomes a part of the Sakata technique.
The first day of the Engulfing pattern has a small real body while the second day has a long one. As the price movement on the second day is much stronger than that on the first day, it may reflect a possible end to the previous trend. If the bearish Engulfing pattern appears after a long movement, it increases the chance that many bulls have already taken long positions. Therefore there might be not enough money to keep the upward market trend intact.
The Engulfing pattern is quite similar to the traditional outside day. Just like in the Engulfing pattern, the outside day shows prices beyond the previous range, with the closing price moving towards the new trend.