 Stay
Stay 
Trading Conditions
Products
Tools


4-hour timeframe
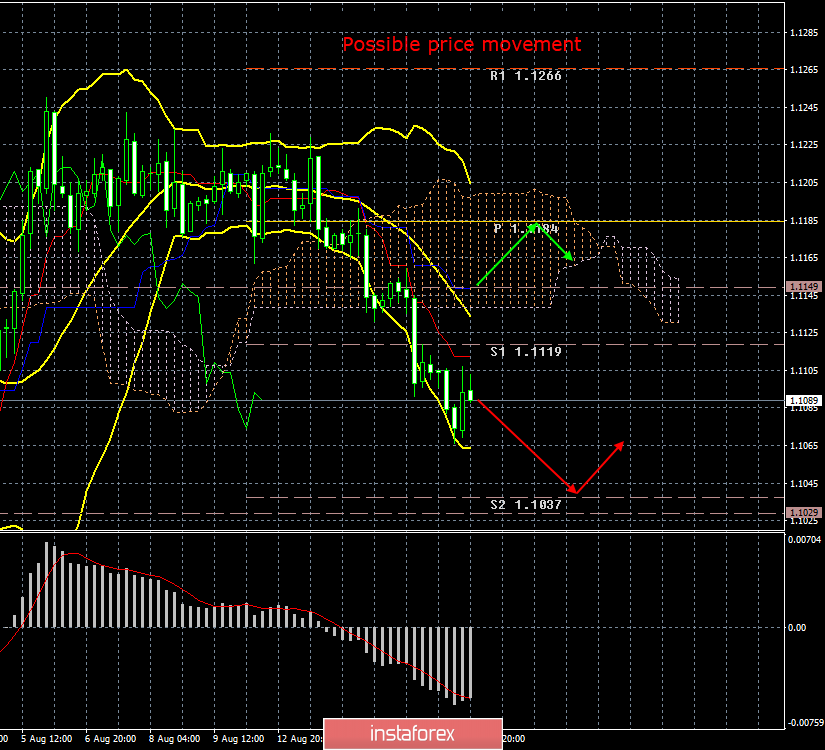
Amplitude of the last 5 days (high-low): 44p - 69p - 59p - 60p - 68p.
Average amplitude over the last 5 days: 60p (58p).
The last trading day of the outgoing week, August 15, turned out to be rather boring in terms of macroeconomic events. In the United States, reports were published on the construction segment, from which it became clear that the number of new building permits exceeded forecasts and amounted to +8.4% in July, but the number of laying new foundations, on the contrary, turned out to be worse than expectations of the foreign exchange market and decreased by 4.0%. Thus, it is difficult to say whether this news was in favor of the dollar or not. The University of Michigan consumer sentiment index also turned out to be worse than analysts forecasts (97.2) and amounted to 92.1. However, first of all, the US dollar still rose in price during Friday's trading, and secondly, the more significant and important reports on retail sales and inflation this week were encouraging in the United States. It is reasonable to note that traders paid more attention to these reports, and not to messages from the construction sector. Moreover, now, we can say, the issue is being solved, will there be a new reduction in the Fed key rate, and if so, when? Recall that the solution to this issue will depend entirely on macroeconomic statistics. If the "figures" do not give cause for concern, then the Fed may well keep the key rate unchanged at a meeting in September. And so far, from our point of view, everything is going to this. We also believe that the softening of monetary policy in September will provide strong support for the US currency, since the European Central Bank will most likely lower its rate in September and will also announce the resumption of the quantitative easing program. Now let's analyze the most important factor for determining and forecasting the euro/dollar exchange rate: the Fed and the ECB rates. The Fed lowered the rate, and the US currency is still growing. What happens if the ECB lowers the rate? Correctly, most likely, the bearish mood of the forex market will intensify even more. The pair's rate is 1.1089, and the low for the last two years is 1.1027. As you can see, the pair is not something that has not rebounded from the lowest values, which is typical for the completion of the downward trend, it continues to slowly slide back to these levels, which makes the probability of further downward movement equal to 80-90%. From a technical point of view, the Ichimoku indicator continues to clearly point down. Even the MACD indicator continues to be directed downward, even signalling an absence of correction.
Trading recommendations:
The EUR/USD pair continues to move down. Thus, on Monday, it is recommended to continue to remain in shorts for the euro/dollar pair with a target of 1.1037 (tomorrow this target will be specified). The bearish mood in the market remains, but the reversal of the MACD indicator will indicate a round of corrective movement. Buying the euro is now impractical, there are no signs of the completion of a downward trend.
In addition to the technical picture, fundamental data and the time of their release should also be taken into account.
Explanation of the illustration:
Ichimoku indicator:
Tenkan-sen is the red line.
Kijun-sen is the blue line.
Senkou Span A - light brown dotted line.
Senkou Span B - light purple dashed line.
Chikou Span - green line.
Bollinger Bands Indicator:
3 yellow lines.
MACD indicator:
Red line and bar graph with white bars in the indicator window.
InstaForex analytical reviews will make you fully aware of market trends! Being an InstaForex client, you are provided with a large number of free services for efficient trading.

