 Stay
Stay 
Trading Conditions
Products
Tools


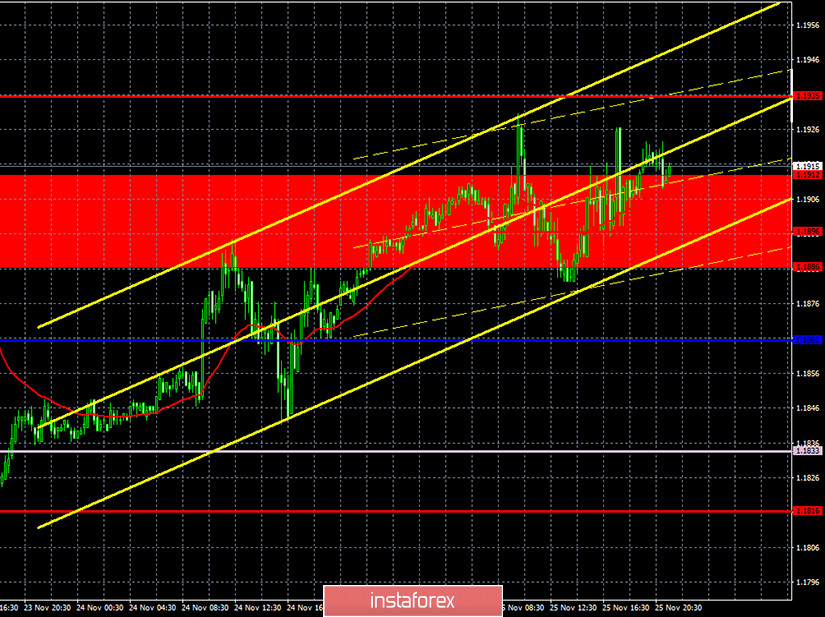
EUR/USD 1H
The EUR/USD pair was trading absolutely incomprehensibly and extremely chaotic on the hourly timeframe on Wednesday, November 25. After the quotes fell by 100 points on Monday, the euro began to recover its positions, which ended with developing the resistance area of 1.1886-1.1912 today. Buyers were unable to guide the pair through this area once again. If it was possible to conclude that the price settled above the horizontal channel of $1.17-$1.19 on higher timeframes, then it is clearly visible that the price did not settle above the upper border of the horizontal channel (2-3 points do not count) on the hourly timeframe. Therefore, despite the fact that the pair has updated the highs of the past and also of this week, it still remains inside the same horizontal channel, in which it has been trading for four months(!!!). There is still no trendline or trend channel that signals at least a short-term trend inside the horizontal channel. This means that trading is really extremely chaotic and it is very difficult to work them out. Traders should take the technical picture into account when opening any positions.
EUR/USD 15M
Both linear regression channels are directed to the upside on the 15-minute timeframe, the bulls' efforts are still not enough to clearly overcome the 1.1886-1.1912 area. Thus, no matter how many attempts they make to gain a foothold above, wherever both linear regression channels are directed and until the price overcomes this area, the upward movement will not proceed further.
COT report
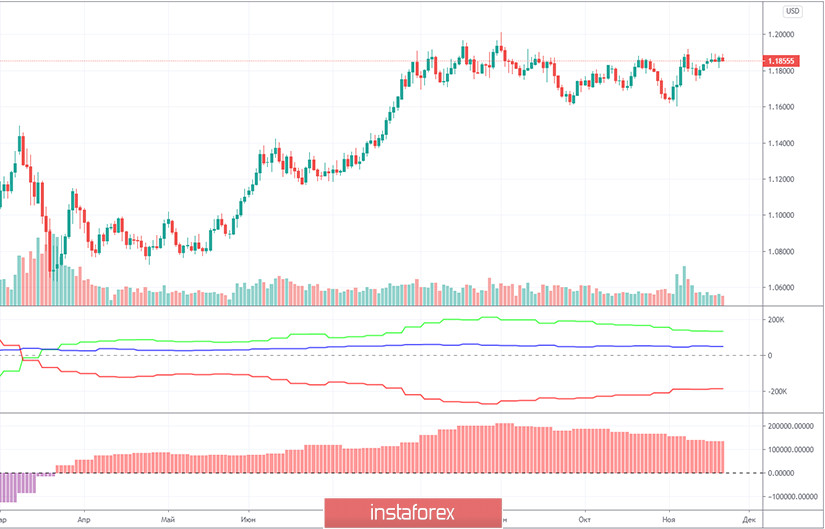
The EUR/USD pair increased by 40 points in the last reporting week (November 10-16). As you can see, price changes are still minimal. There were certain bursts of activity during the US presidential elections, but they ended very quickly and now the pair is just trading in a horizontal channel, with minimal volatility. Therefore, we expect clarification of the current situation from the Commitment of Traders (COT) reports. Unfortunately, COT reports for the last 8-10 weeks now show that non-commercial traders are reducing their net position. This means that their sentiment is becoming more bearish. The green and red lines of the first indicator show the net positions of commercial and non-commercial traders, and when they are far from each other, this is considered a strong signal for a trend change. However, the lines have moved away and they have been moving towards each other for two months now. There is no downward trend. The "non-commercial" group of traders, which is the most important and significant, opened 2,000 Buy-contracts (longs) and 1,500 Sell-contracts (shorts) for the euro during the reporting week. Therefore, there is simply no change in the mood of this group of traders. We are much less interested in other groups of traders. In general, we have a somewhat paradoxical situation, as professional traders have been reducing the number of purchases of the euro currency and increasing sales for more than two months, but the euro does not fall. Nevertheless, based on the data of the report, we still believe that the peak of the entire upward trend was near the 1.2000 level and sooner or later the downward movement will start.
All the most important macroeconomic reports were released in the US on Wednesday. Durable goods orders reports exceeded forecasted values, but the gains were small. Therefore, the dollar did not receive enough market support based on these data. The main indicator increased by 1.3% m/m (forecast +0.9%), the indicator excluding defense and aviation orders increased by 0.7% (forecast +0.5%), the indicator excluding transport orders increased by 1.3% (forecast +0.4%), the indicator excluding defense increased by 0.2%.
No important macroeconomic report or fundamental event from the European Union and the United States on Thursday, November 26. Therefore, traders will have nothing to react to during the day. However, fundamental and macroeconomic backgrounds are now less important than the technical picture. It all comes down to technique, because the foundation and macroeconomics could not bring the pair out of the horizontal channel in four months. Thus, we tend to believe that whatever the news is, it is unlikely to help buyers or sellers.
We have two trading ideas for November 26:
1) Buyers are still struggling to overcome the 1.1886-1.1912 resistance area, although they had five or six attempts to do so in the last ten days. Therefore, you are advised to open new long positions while aiming for the resistance levels of 1.1935 and 1.1976 if the price has firmly settled above the 1.1886-1.1912 area. Take Profit in this case will be no more than 55 points.
2) Bears keep the pair inside the horizontal channel and refuse to allow buyers to take it out of it. Therefore, you are advised to open new sell orders while aiming for the Senkou Span B line (1.1833) and support levels 1.1816 and 1.1775 if the price settles below the Kijun-sen line (1.1865). Take Profit in this case can be up to 80 points.
Forecast and trading signals for GBP/USD
Explanations for illustrations:
Support and Resistance Levels are the levels that serve as targets when buying or selling the pair. You can place Take Profit near these levels.
Kijun-sen and Senkou Span B lines are lines of the Ichimoku indicator transferred to the hourly timeframe from the 4-hour one.
Support and resistance areas are areas from which the price has repeatedly rebounded off.
Yellow lines are trend lines, trend channels and any other technical patterns.
Indicator 1 on the COT charts is the size of the net position of each category of traders.
Indicator 2 on the COT charts is the size of the net position for the "non-commercial" group.
InstaForex analytical reviews will make you fully aware of market trends! Being an InstaForex client, you are provided with a large number of free services for efficient trading.

