 Stay
Stay 
Trading Conditions
Products
Tools


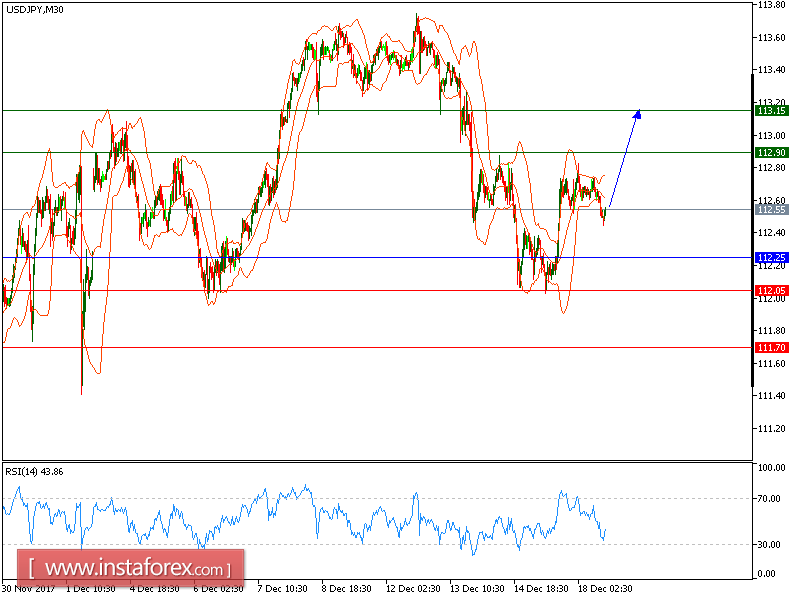
USD/JPY is expected to trade with a bullish outlook. The pair remains on the upside after breaking above a declining trend line drawn from December 12. Currently, it is striking against the upper Bollinger band while being supported the ascending 20-period moving average, which stands above the 50-period one. The relative strength index is well directed into the 60s, showing continued upward momentum for the pair. Intraday bullishness persists, and the pair should target 113.15 upon reaching 112.90. Key support is located at 112.25.
However, as long as the key support at 113.15 is not breached, the intraday outlook is still bullish and the pair stands chances of revisiting 113.75 on the upside.
Alternatively, if the price moves in the opposite direction, a short position is recommended below 112.25 with a target of 112.05.
Chart Explanation: The black line shows the pivot point. The current price above the pivot point indicates a bullish position, while the price below the pivot point is a signal for a short position. The red lines show the support levels and the green line indicates the resistance level. These levels can be used to enter and exit trades.
Strategy: BUY, Stop Loss: 112.25, Take Profit: 112.90
Resistance levels: 112.90, 113.15 and 113.50 Support Levels: 112.05, 111.70, 111.30
InstaForex analytical reviews will make you fully aware of market trends! Being an InstaForex client, you are provided with a large number of free services for efficient trading.


