 Stay
Stay 
Trading Conditions
Products
Tools

The index is having a bullish momentum and looks forward to breaking above the 200 SMA at the H1 chart, in an effort to reach the March 20th highs. However, the support zone of 89.36 could get broken and could allow additional losses to test the support level of 87.88. To the upside, a critical resistance is located at 90.63.
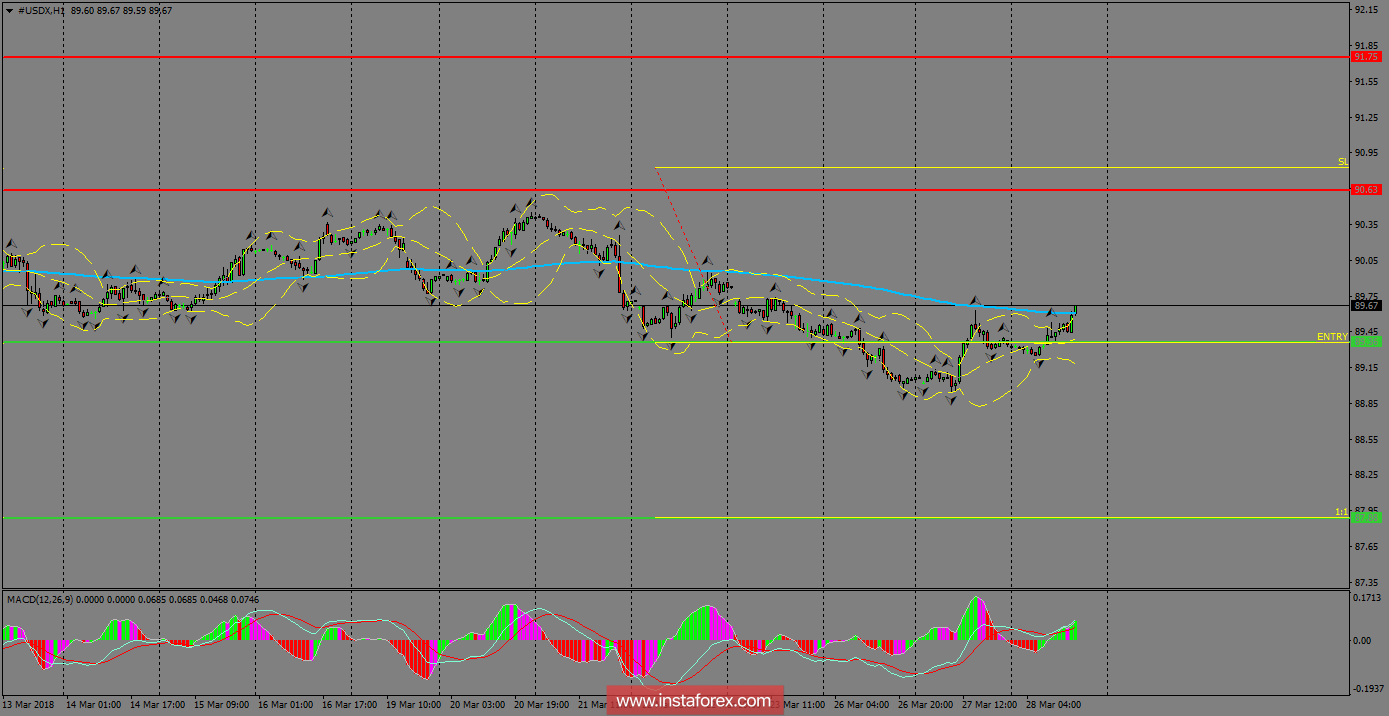
H1 chart's resistance levels: 90.63 / 91.75
H1 chart's support levels: 89.36 / 87.88
Trading recommendations for today: Based on the H1 chart, place sell (short) orders only if the USD Index breaks with a bearish candlestick; the support level is at 89.36, take profit is at 87.88 and stop loss is at 90.81.InstaForex analytical reviews will make you fully aware of market trends! Being an InstaForex client, you are provided with a large number of free services for efficient trading.


