 Stay
Stay 
Trading Conditions
Products
Tools


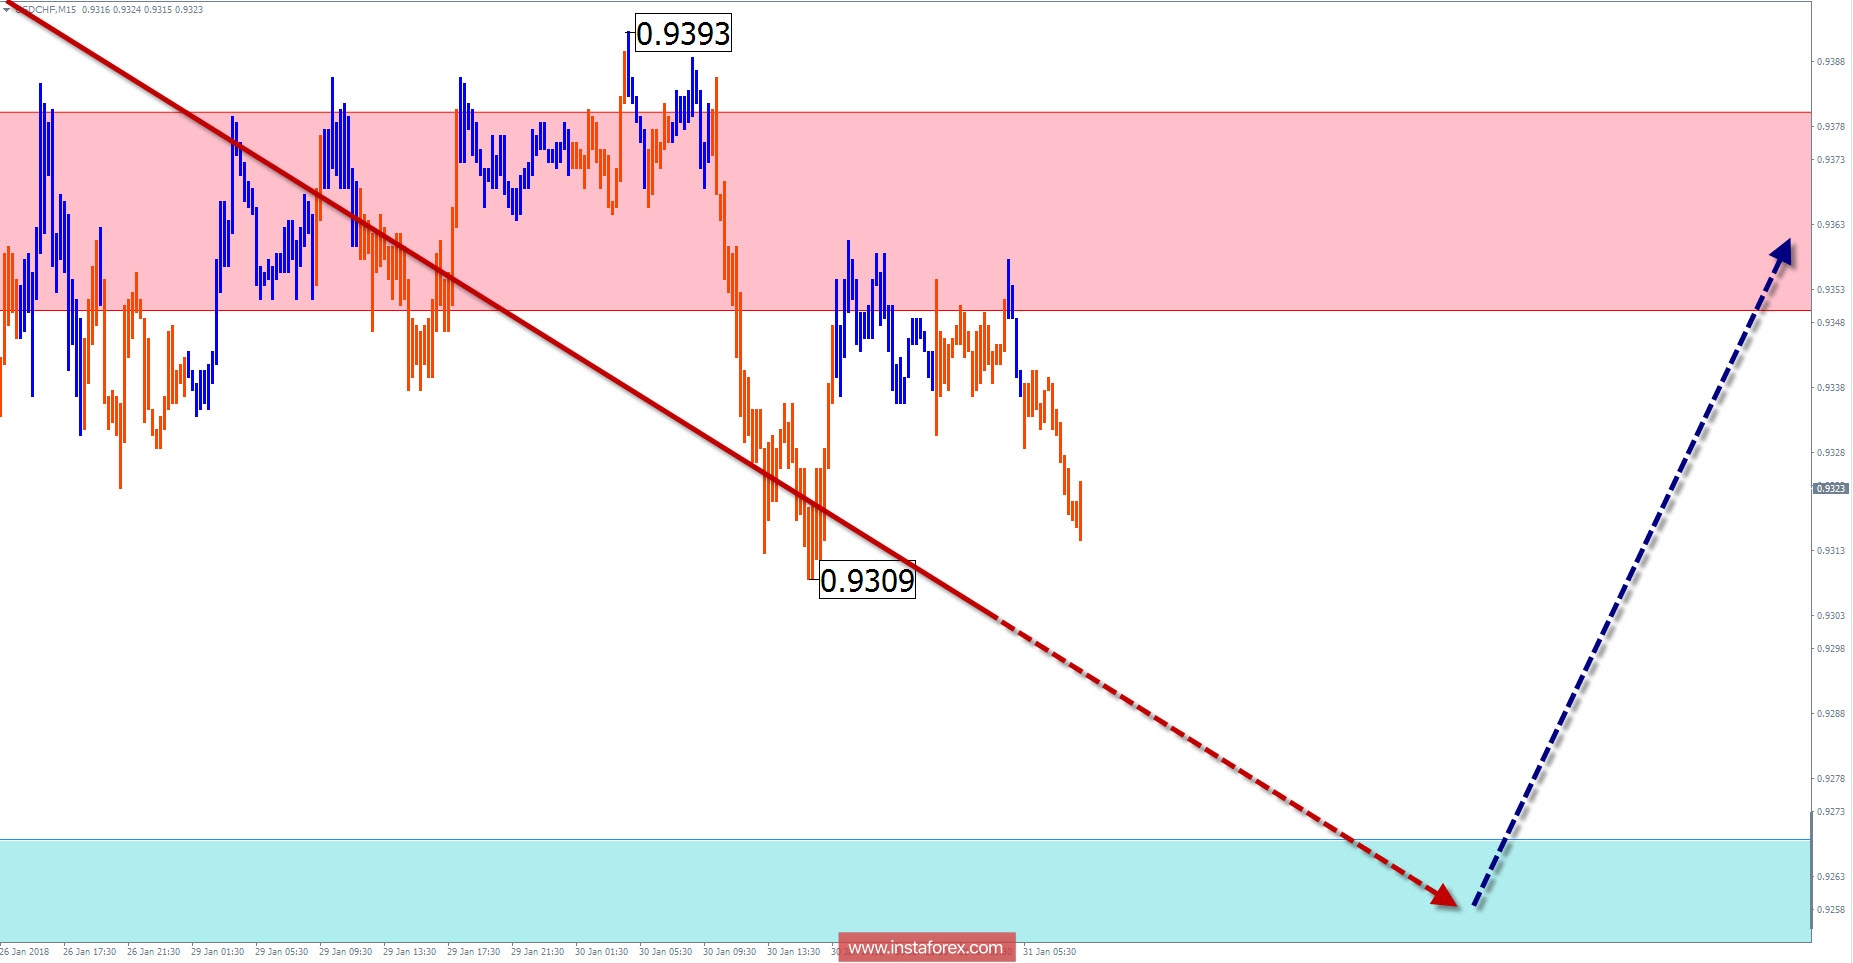
Overview and forecast for the currency pair USD / CHF
As a result of the active depreciation of the main pair of Swiss francs, the quotes have closely approached the upper boundary of a wide range of potential large-scale reversals. Analysis of the last wave on the daytime frame of the instrument shows the completeness of its structure. The proportions of the final part of the wave approach the standard dimensions. In the coming weeks, there is a sharp increase in the probability of changing the direction of the short-term trend, at least to correct the last part of the main trend.
In the next trading sessions, a downward movement is expected, with the prospect of reaching the upper boundary of settlement support. Then, you can count on a turn and a price rebound up.
Boundaries of the resistance zones:
- 0.9350 / 80
Boundaries of the support zones:
- 0.9270 / 40
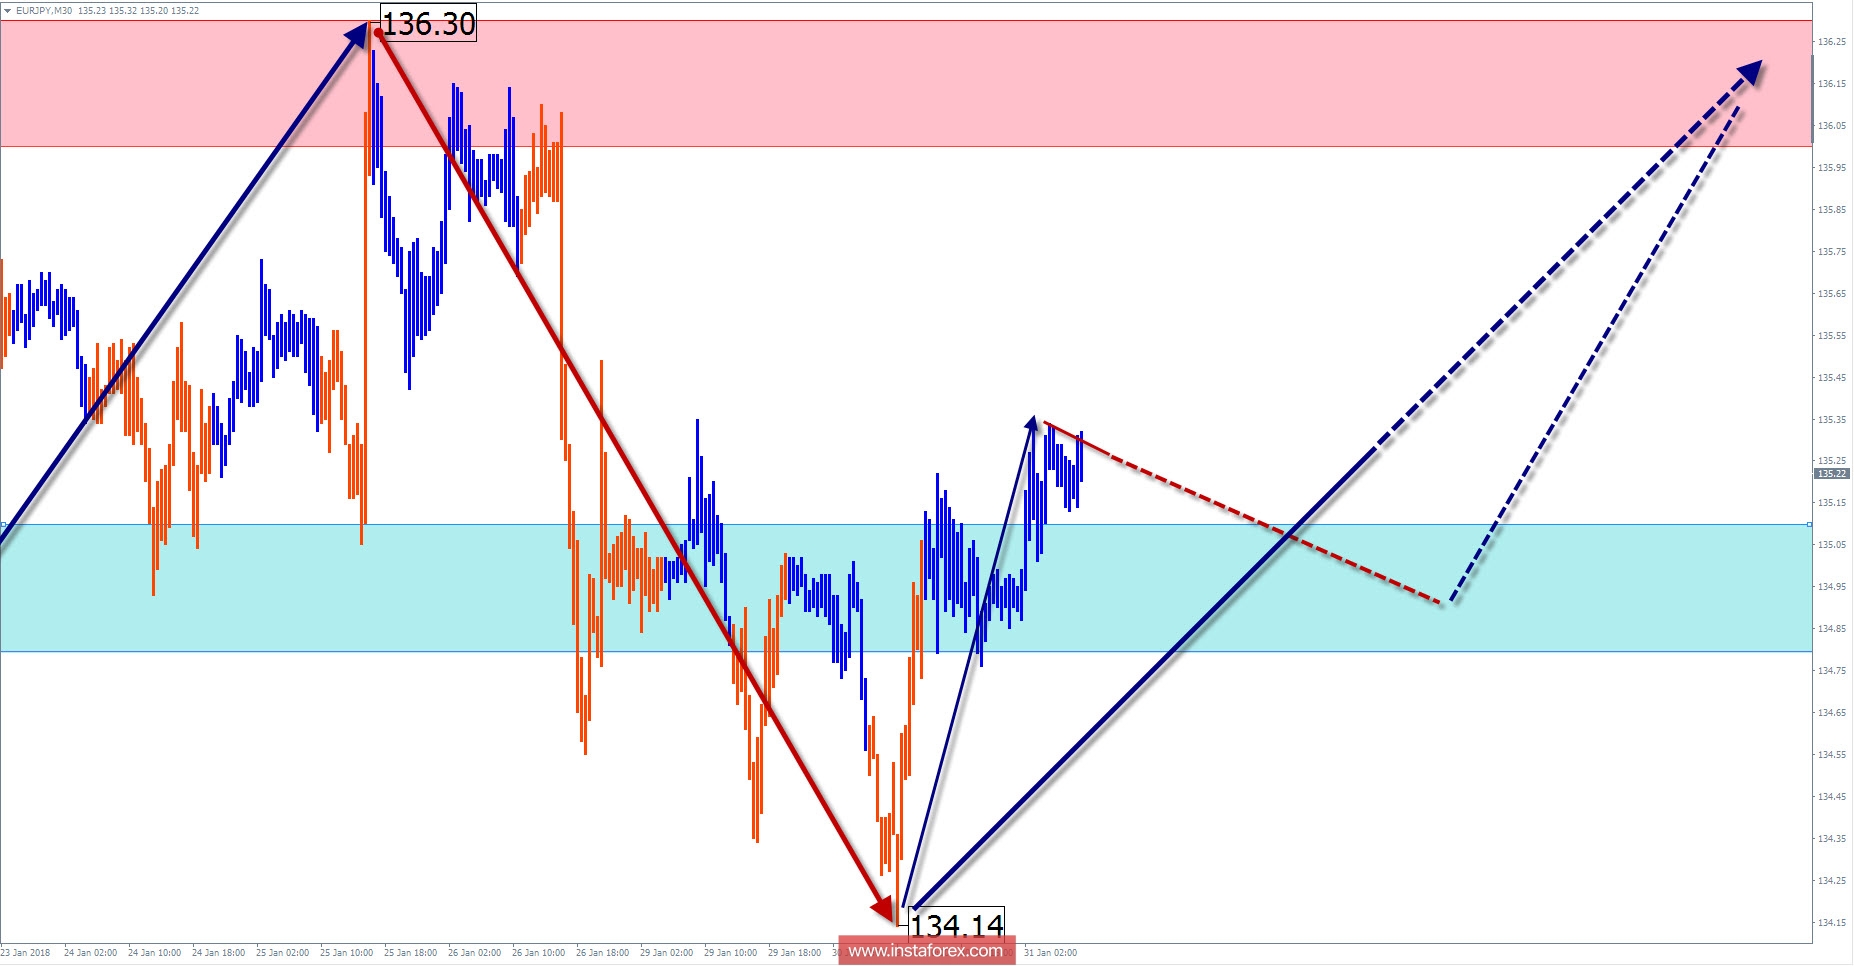
Overview and forecast for the currency pair EUR / JPY
The direction of the price trend in the euro / yen cross-country market is set by the upward wave of April 17 last year. This trend completes a larger wave model, with a pronounced impulse character of motion.
The last site started on January 10. At the moment of analysis, the middle part of the bull zigzag (B) is completed in the wave structure. The price rise that began yesterday may be the beginning of a reversal construction.
In the morning, the flute mood is expected today. The price for the lower edge of the support zone is unlikely. By the end of the day, you can count on the beginning of the growth of quotations.
Boundaries of the resistance zones:
- 136.00 / 136.30
Boundaries of the support zones:
- 135.10 / 134.80
Explanations to the figures: For simplified wave analysis, the simplest type of wave is used in the form of a zigzag, combining 3 parts (A; B; C). Of these waves, all kinds of correction are composed and most of the impulses. At each time frame, the last, incomplete wave is analyzed.
The areas marked on the graphs are indicated by the calculation areas, where the probability of a change in the direction of motion is significantly increased. Arrows indicate the wave counting according to the technique used by the author. The solid background of the arrows indicates the structure formed, the dotted one indicates the expected wave motion.
Attention: The wave algorithm does not take into account the duration of the tool movements in time. The forecast is not a trading signal! To conduct a trade transaction, you need to confirm the signals of your trading systems.
InstaForex analytical reviews will make you fully aware of market trends! Being an InstaForex client, you are provided with a large number of free services for efficient trading.

