 Stay
Stay 
Trading Conditions
Products
Tools


In the past year and a half, the quotations of the GBP / JPY pair as the most volatile currency in the market is moving north steadily on the chart. The price zone of a potential large-scale reversal could provoke a corrective decline. To delay the rise in the price of the price for a long time.
Since early March, the price has stopped falling that changed the nature of price fluctuations for intensive growth. There are indications of a recovery which is beyond the correction of the previous decline. Obviously, the hidden correction of the instrument at the lowest possible level of decline has already been completed, and a new round of the main trend is beginning to occur.
Until the end of this month, there is a possibility of a decline to the settlement level on the support. The beginning of the next promises to be positive for the bulls.
Boundaries of resistance zones:
- 154.00 / 154.50
Boundaries of support zones:
- 150.00 / 149.50
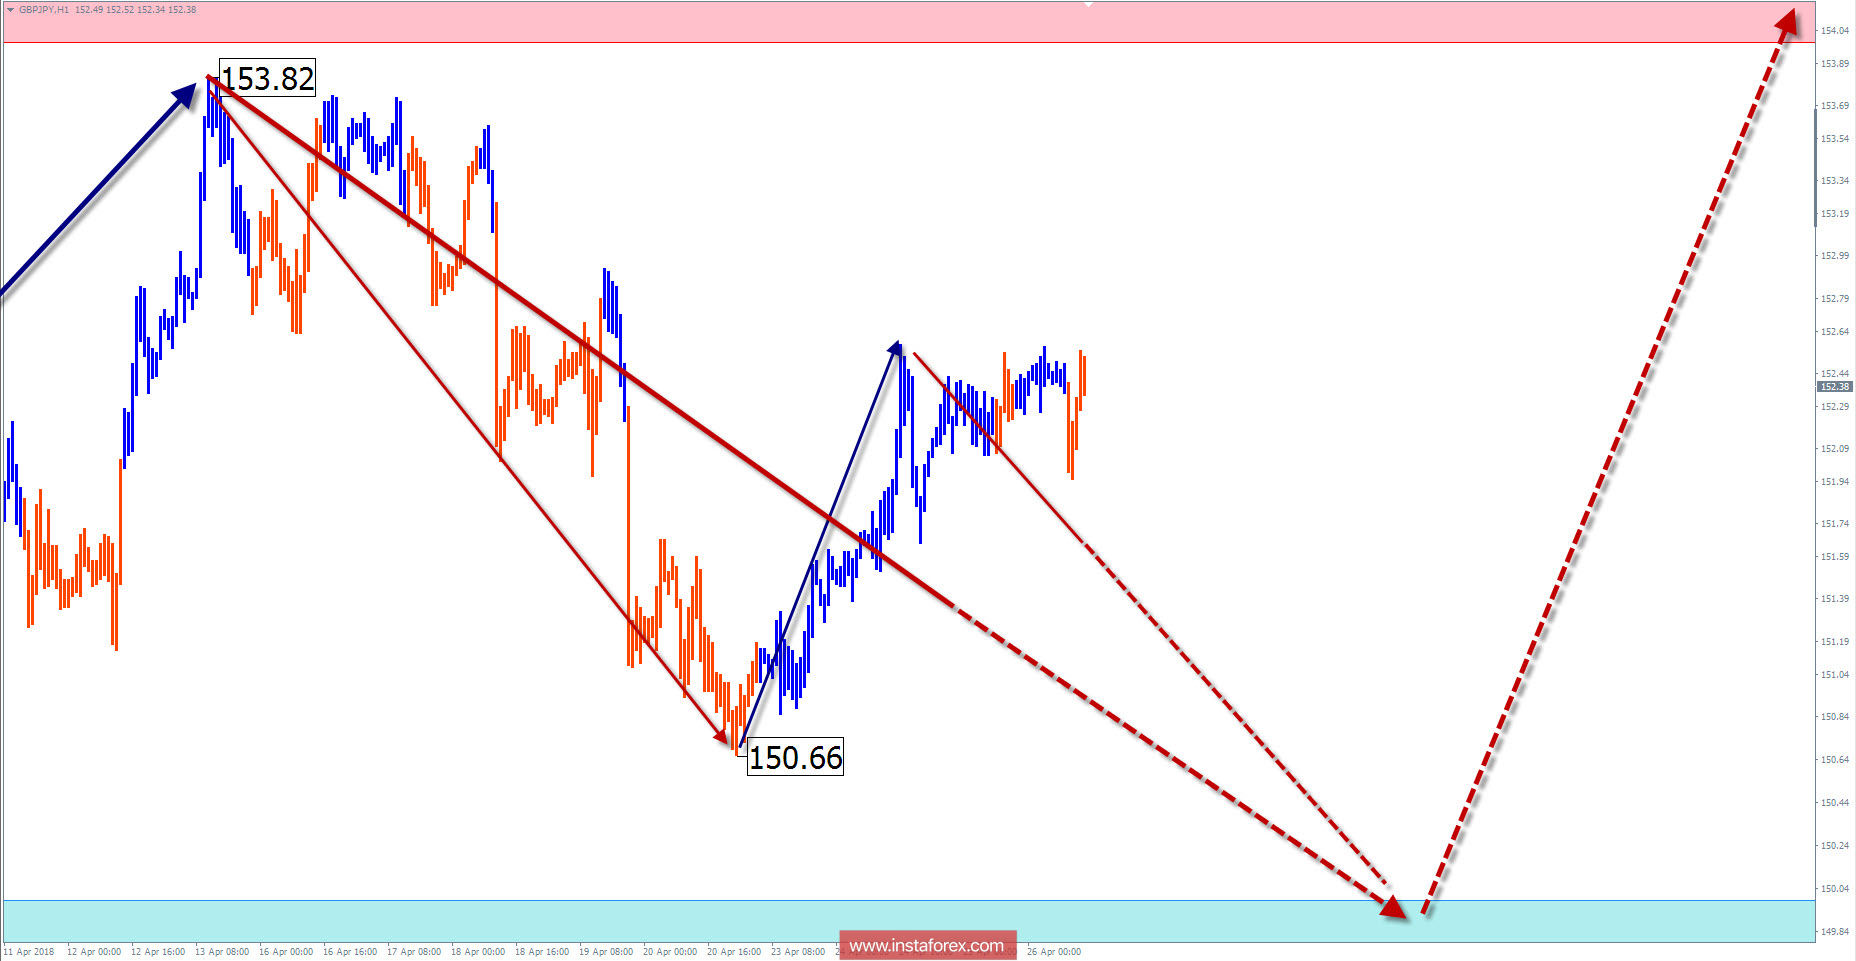
Explanations of the figures:
For simplified wave analysis, a simple waveform is used that combines 3 parts namely A, B, and C. All types of correction are created and most of the impulses can be found in these waves. Every time frame is considered and the last incomplete wave is analyzed.
The areas marked on the graphs indicate the probability of a change in the direction of motion has significantly increased as calculated in the areas. Arrows indicate the wave counting following the technique used by the author. A solid background of the arrows signifying the structure has been formed while the dotted one means the expected wave motion.
Attention: The wave algorithm does not take into account the duration of the movement of tools in time. The forecast is not a trading signal! To conduct a bargain, you need to confirm the signals used by your trading systems.
InstaForex analytical reviews will make you fully aware of market trends! Being an InstaForex client, you are provided with a large number of free services for efficient trading.


