 Stay
Stay 
Trading Conditions
Products
Tools


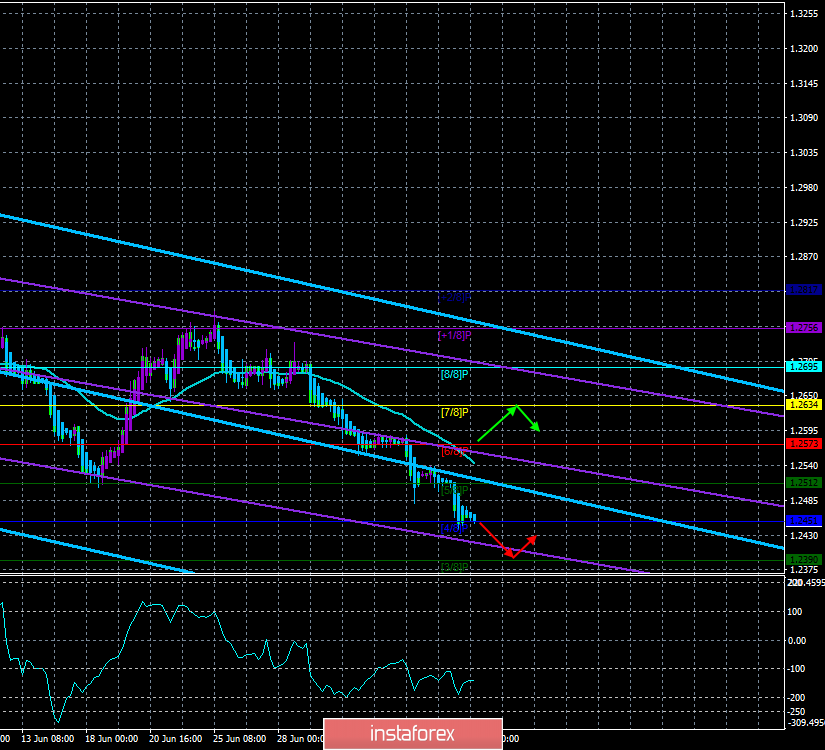
4-hour timeframe
Technical data:
The upper linear regression channel: direction – down.
The lower linear regression channel: direction – down.
The moving average (20; smoothed) – down.
CCI: -130.0810
On Wednesday, July 10, the currency pair pound/dollar continues to strengthen the downward movement without any hint of a reversal to the upside. In addition to Jerome Powell's speech in Congress today, the pair pound/dollar will be influenced by reports from the UK on GDP and industrial production for May. According to forecasts, GDP growth rates will slow down, and industrial production, on the contrary, will "revive" after the failed April, when a fall of 1.0% y/y was recorded. However, the question is whether the real values of these indicators will exceed the forecasted ones. Will traders ignore these reports altogether, focusing entirely on Powell's performance? Will the market ignore all the events of today, completely focusing on the political crisis in Britain and the absolutely chaotic Brexit? Most likely, any positive information today will contribute to the strengthening of the pound sterling maximum to the moving average line. Any negative information – just become the basis for bears for new sales of the pound sterling. From a technical point of view, the indicator Heiken Ashi continues to calmly paint the bars in blue, which signals a continuous downward movement. To update a minimum of 2019, 3 points remain.
Nearest support levels:
S1 – 1.2451
S2 – 1.2421
S3 – 1.2390
Nearest resistance levels:
R1 – 1.2482
R2 – 1.2512
R3 – 1.2543
Trading recommendations:
The currency pair GBP/USD continues its downward trend. Thus, traders are advised to continue selling the pound sterling with targets at 1.2421 and 1.2390. There are no signs of an upward correction at the moment.
Buying the pair pound/dollar will be small lots with targets at 1.2604 and 1.2634 after fixing the price above the moving average line. However, to do this, the bulls will need fundamental support, which will now be extremely difficult to obtain.
In addition to the technical picture should also take into account the fundamental data and the time of their release.
Explanation of illustrations:
The upper linear regression channel – the blue line of the unidirectional movement.
The lower linear regression channel – the purple line of the unidirectional movement.
CCI – the blue line in the indicator regression window.
The moving average (20; smoothed) is the blue line on the price chart.
Murray levels – multi-colored horizontal stripes.
Heiken Ashi is an indicator that colors bars in blue or purple.
InstaForex analytical reviews will make you fully aware of market trends! Being an InstaForex client, you are provided with a large number of free services for efficient trading.


