 Stay
Stay 
Trading Conditions
Products
Tools


4-hour timeframe
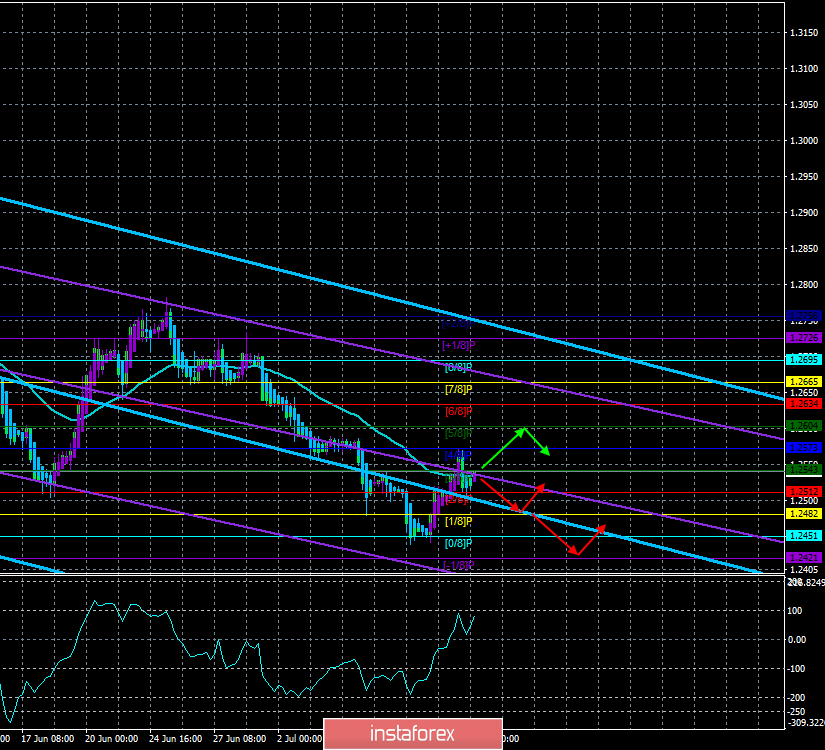
Technical data:
The upper linear regression channel: direction – down.
The lower linear regression channel: direction – down.
The moving average (20; smoothed) – sideways.
CCI: 86.8250
If the euro shows signs of life and gives hope for the formation of a more or less strong upward trend, the pound is moving up with great difficulty. At the moment, the pair pound/dollar barely worked the moving and cannot yet overcome it, unlike the euro/dollar pair, despite the fact that both speeches by Jerome Powell in Congress apply to it. This once again proves the fact that traders on the pound are afraid to buy this currency, even when there are fundamental reasons for this. Roughly speaking, traders are not particularly attracted to the prospect of buying the British currency because of the fear of its possible collapse at any time. Is it worth repeating for the thousandth time that Brexit is to blame and that until it is brought to a logical conclusion, we should not expect a serious strengthening of the pound? The maximum that the pound can expect in the coming months is a correction. On the last trading day of the week, July 11, no important macroeconomic publications are planned either in the UK or in the States. Thus, there will be no special reasons for the growth of the pound again. Nevertheless, paying attention to the technical indicators, it is worth noting that the pair will be best to sell after the reversal of the Heiken Ashi indicator down and the departure of the pair's quotes from the moving average line.
Nearest support levels:
S1 – 1.2512
S2 – 1.2482
S3 – 1.2451
Nearest resistance levels:
R1 – 1.2543
R2 – 1.2573
R3 – 1.2604
Trading recommendations:
The currency pair GBP/USD continues the upward correction. Thus, traders are recommended to resume selling the pair with the targets at 1.2451 and 1.2421, if the bears manage to stay below the moving average.
Buy the currency pair pound/dollar in small lots with targets at 1.2604 and 1.2634 after fixing the price above the moving average line.
In addition to the technical picture should also take into account the fundamental data and the time of their release.
Explanation of illustrations:
The upper linear regression channel – the blue line of the unidirectional movement.
The lower linear regression channel – the purple line of the unidirectional movement.
CCI – the blue line in the indicator regression window.
The moving average (20; smoothed) is the blue line on the price chart.
Murray levels – multi-colored horizontal stripes.
Heiken Ashi is an indicator that colors bars in blue or purple.
InstaForex analytical reviews will make you fully aware of market trends! Being an InstaForex client, you are provided with a large number of free services for efficient trading.

