 Stay
Stay 
Trading Conditions
Products
Tools


GBP / USD pair
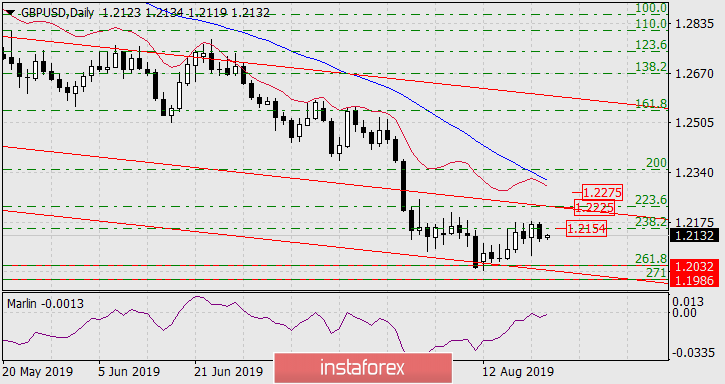
The British pound returned below the Fibonacci level of 238.2% of the base outcome of the movement from March 13 to April 25. The signal line of the Marlin oscillator met strong resistance on the border territory of the bulls. Another exit of the price over 1.2154 may provoke continued growth to 1.2225 - to the point where the Fibonacci level coincides with 223.6% with the downward line of the price channel.
On the four-hour chart, the price found support from the balance indicator line, which indicates the preservation of the market balance mainly for purchases. The Marlin oscillator penetrated insignificantly into the zone of negative numbers. Taking into account fluctuations, the signal line of the oscillator can be accepted as being on the border with the territory of the bears. Here, the MACD line (blue color) pays more attention to itself. It turned upward, which is an indication of the direction of the medium and short-term trend.
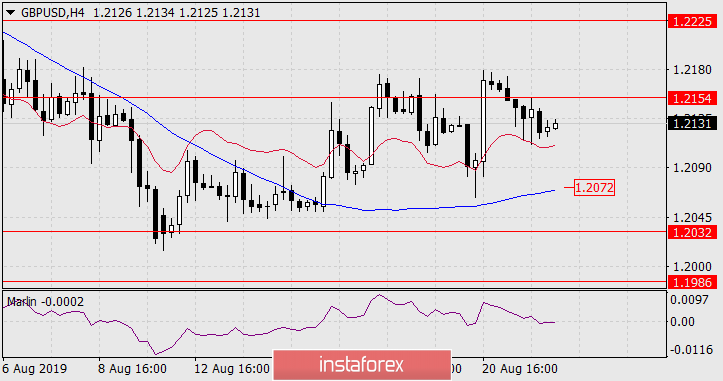
Thus, a high probability is the rise in prices with a target of 1.2225. It is possible to overcome this goal by working out the MACD line of a daily scale in the region of 1.2275. To develop a lowering scenario, the price needs to gain a foothold under the MACD line below 1.2072 oN the four-hour chart. The breakdown of the MACD line against its direction in the range of a turn is always associated with increased volatility.
InstaForex analytical reviews will make you fully aware of market trends! Being an InstaForex client, you are provided with a large number of free services for efficient trading.


