 Stay
Stay 
Trading Conditions
Products
Tools


4-hour timeframe
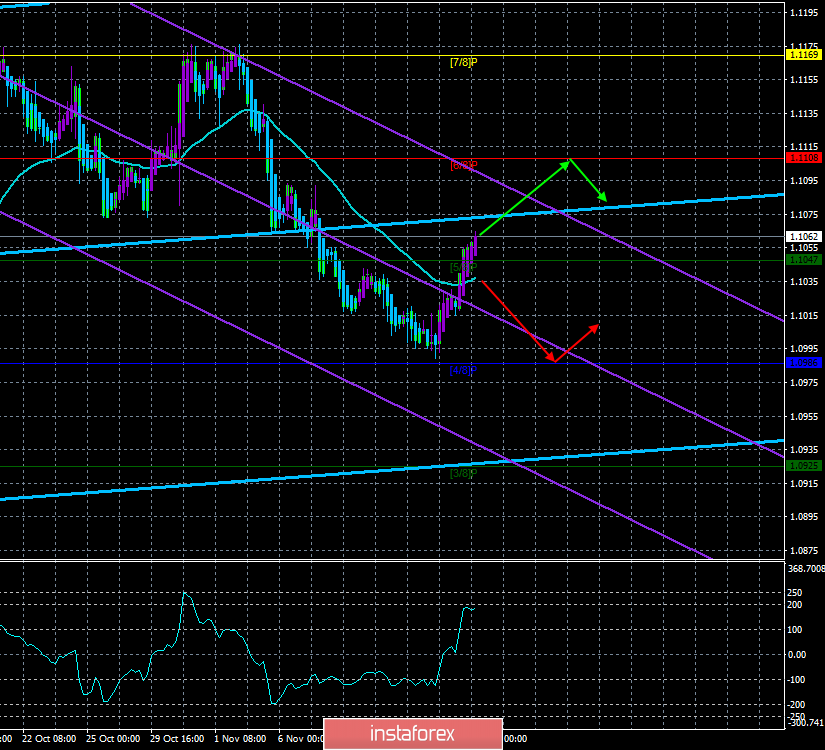
Technical data:
The upper channel of linear regression: direction – up.
The lower channel of linear regression: direction – down.
The moving average (20; smoothed) – up.
CCI: 182.9630
Well, last week ended with the strengthening of the European currency although the pair could continue to move down based on fundamental factors. However, the report on industrial production in the United States, which recorded a decline of 0.8% m/m disappointed traders, which triggered a new round of upward movement of the pair. At the same time, volatility remains extremely low, no more than 40 points per day, thus, to call the current growth of the pair strong language does not turn. At the same time, there was a consolidation of quotes of the euro/dollar pair over the moving average line, which indicates a change in the upward trend. As we warned, a purely corrective growth of the euro currency is now possible, since, for more serious purchases of the dollar, traders do not have the necessary fundamental background at their disposal now.
The first trading day of the week in terms of macroeconomic data, as it often happens, is empty. Thus, today volatility may not exceed 20-30 points at all. Of course, Donald Trump can always come to the forefront and "shake" the markets with another loud statement. But such actions of the American President cannot be predicted. Meanwhile, "constructive talks" on a trade deal between China and the US are continuing. This is reported by the website of the Ministry of Commerce of China. According to the information received, the heads of the negotiating delegations of China and the United States held a telephone conversation and once again discussed the key issues of the "first phase" agreement. And of course, where would it be without the traditional assurances of the parties that "the negotiations were successful." "Negotiations have been going on successfully" for more than a year now, and the parties are only happy to introduce new duties against each other, but they are not going to cancel them yet. In such a situation, it should be recalled that such transactions, which will determine the trade relations between the two largest economies of the world for perhaps decades, can be conducted for many years. For example, it took seven years for Canada and the European Union to sign a free trade agreement. Firstly, it means that Donald Trump is not likely to sign an agreement with Beijing. Secondly, the US dollar is unlikely to respond within seven years to the news of "constructive negotiations." Thus, we recommend that traders focus on current news, on macroeconomic reports that are influenced by events that occur between China and the United States. It's no secret that the trade war led to a slowdown in the global economy, as well as to a slowdown in the economies of the United States and China. Thus, the macroeconomic indicators of these countries perfectly reflect "at what stage are the negotiations between the parties now." But the US president can gladly introduce new duties on imports from China if Beijing continues to drag out negotiations or fail to comply with the terms of oral agreements. For some reason, much more is believed in this version of the development of events than in the one that involves agreeing before the New Year. Recall that Trump expects to sign the deal until December 31, after which, most likely, China will impose new duties.
The topic of impeachment of Donald Trump has stalled again, but we have already talked about the fact that the Democrats will not be able to remove Trump from office. And it doesn't make much sense since a year later the presidential election will be held, in which Trump, if he does not agree with China, has low chances of victory. And throughout the next year, Trump and the Democrats will actively "pour mud on each other" as part of the election campaign.
From a technical point of view, the trend for EUR/USD is now upward, but we believe that the growth of the pair now can only be corrective. The potential maximum target of the upward movement is Murray's level of "7/8" - 1.1169. Above this level, we do not see the euro currency.
Nearest support levels:
S1 – 1.1047
S2 – 1.0986
S3 – 1.0925
Nearest resistance levels:
R1 – 1.1108
R2 – 1.1169
R3 – 1.1230
Trading recommendations:
The euro/dollar pair began to adjust against the downward trend. Thus, long positions formally became relevant with a target of 1.1108, which can be worked out. Heiken Ashi indicates an upward trend in intraday. It is recommended to return to the sales of the euro/dollar pair not earlier than the consolidation of traders below the moving average line with the target of 1.0986.
In addition to the technical picture, fundamental data and the time of their release should also be taken into account.
Explanation of the illustrations:
The upper channel of linear regression – the blue line of the unidirectional movement.
The lower channel of linear regression – the purple line of the unidirectional movement.
CCI – the blue line in the indicator window.
The moving average (20; smoothed) – the blue line on the price chart.
Support and resistance – the red horizontal lines.
Heiken Ashi – an indicator that colors bars in blue or purple.
Possible variants of the price movement:
Red and green arrows.
InstaForex analytical reviews will make you fully aware of market trends! Being an InstaForex client, you are provided with a large number of free services for efficient trading.

