 Stay
Stay 
Trading Conditions
Products
Tools


Hello everyone!
In this article, we will look at the technical picture of the dollar/franc currency pair in detail. Before moving on to the technical part of the review, let me remind you once again to look at the economic calendar, which this week is scheduled for many different reports from the United States. In the previous two articles, I have already indicated them, so I do not see the point of repeating them.
The only thing I would like to add on EUR/USD is that only the single European currency and the Swiss franc grew against the US dollar last week. However, this is not quite true. The Canadian dollar also strengthened against its namesake from the United States.
Weekly
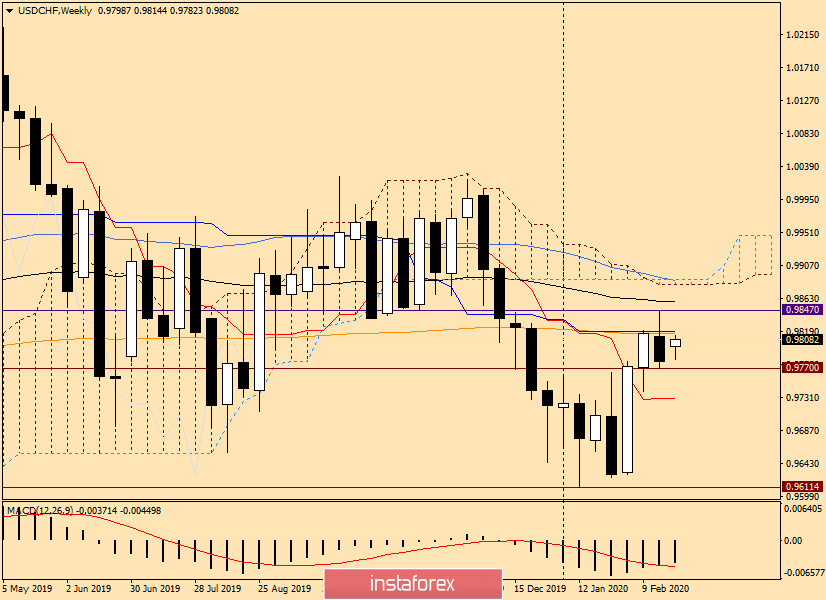
After the previous two-week growth, a bearish candle appeared at the last five-day trading session, which is located inside the body of the previous bullish one. This model of candlestick analysis is called "Harami" and is a reversal. However, it also requires confirmation. But we won't wait for the whole week that has just begun, so we will start analyzing and looking for points for entering the market here and now.
To begin with, it is necessary to indicate the highs and lows of previous trades, which will serve as a kind of benchmark for the price direction of USD/CHF. Trading lows on February 17-21 were shown at a strong technical level of 0.9770 and highs at 0.9847. I believe that the further price dynamics of USD/CHF may depend on the breakdown of one of these levels.
Although not everything is so clear and simple. At the moment of writing, the pair shows moderate growth and the nearest resistance that the rate may encounter is located near 0.9820. The strong technical level itself will undoubtedly be strengthened by the 200 exponential moving average and the Kijun line of the Ichimoku indicator.
Only after passing the level of 0.9820 the pair will try to rewrite the previous highs at 0.9847. However, it should be taken into account that right under the strong technical mark of 0.9860, there is an 89 exponential average, which can provide decent resistance to the pair's attempts to move in the north direction.
If the lows of the previous weekly trading are updated at 0.9770, the decline will continue towards the Tenkan line, which is located at 0.9730.
Daily
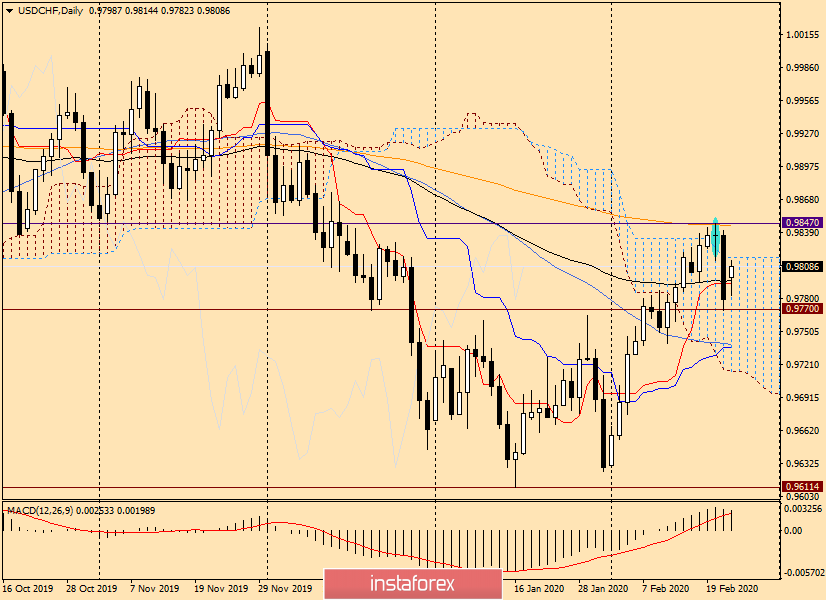
If you go to the daily chart, then after the appearance of the reversal candle model from February 20, the pair literally collapsed the next day, falling within the limits of the Ichimoku indicator cloud.
Right now, trading is being conducted above 89 EMA and Tenkan. The main task of players to raise the price is to bring the price up from the cloud, the upper limit of which is at 0.9817.
I don't think this will be easy to do. But even with the success of this mission, the main resistance is concentrated near 0.9845. First, there is a strong 200 exponential moving average. Secondly, the resistance level of 0.9847 is almost above it, where the highs of trading on February 20 were shown and where the long-legged Doji candlestick analysis reversal model was formed.
So, judging by the weekly and daily timeframes, sales can be viewed from the price range of 0.9815-0.9845. An additional signal for opening short positions on the dollar/franc pair will be the appearance of a bearish reversal candle or a combination of candles on the daily chart.
H4
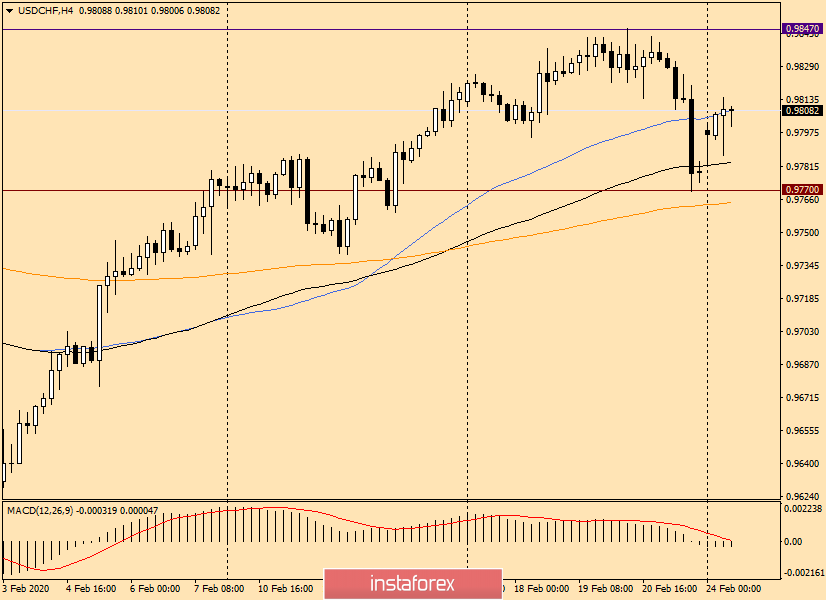
But at the 4-hour chart, everything looks more in favor of the growth rate. I think that it is necessary to wait for the rise to the area of 0.9840 and track the candlestick signals there. If there are bearish ones, sell them.
As it is clear from this review, the main trading idea for the USD/CHF pair is sales from the indicated price targets. However, this does not mean that there is no room for purchases. However, at the moment, I do not see good signals for opening short positions.
Good luck!
InstaForex analytical reviews will make you fully aware of market trends! Being an InstaForex client, you are provided with a large number of free services for efficient trading.


