 Stay
Stay 
Trading Conditions
Products
Tools


US unemployment data is extremely important, especially now.
Hello, dear traders!
There is no getting away from the topic of COVID-19, so at the beginning of this article, we will have to touch on it again.
According to the head of the World Trade Organization (WTO), which is based on the opinion of authoritative experts, the recession in the global economy and unemployment can exceed the crisis times of 2008-2009. However, such forecasts have already been given more than once, and the opinion of the head of the WTO cannot be called something unexpected.
However, it is worth recognizing that data on unemployment in the world's largest economy, especially now, is extremely important. Let me remind you that today at 13:30 (London time), information on initial applications for unemployment benefits will be received from the United States of America, and at the same time, the final data on US GDP for the 4th quarter will be published.
It is highly likely that these macroeconomic reports will have a significant impact on the pair of North American dollars. In the meantime, let's go to the technical picture, which is observed for the USD/CAD pair, and for greater clarity, let's start with the weekly chart.
Weekly
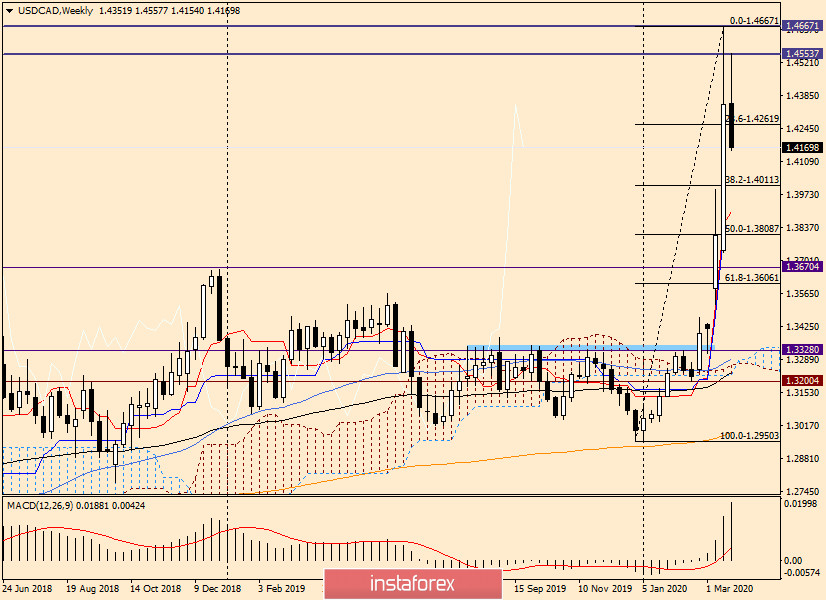
The impressive growth shown by the pair last week was overshadowed by a fairly impressive upper shadow. After reaching 1.4667, the quote fell to 1.4344, where the auction ended on March 16-20.
Usually, when the candle has such a significant shadow, it becomes obvious that the bulls could not keep the price near the reached highs and further growth remains in question. And indeed, after the opening of trading this five-day period, attempts to continue the rate rise were limited only to the level of 1.4557, which is significantly lower than the previous highs. As you can see, after this, the pair turned in the south direction and is corrected to its previous growth.
At the moment, this can be described as a corrective pullback, and more definite conclusions can be drawn only after the end of the current weekly trading.
If you stretch the grid of the Fibonacci tool to the rise of 1.2950-1.4667, we see that the pair has already overcome the first pullback level of 23.6 from this movement. If the correction continues, the "Canadian" will move to the next level of 38.2 Fibo, which passes in close proximity to the iconic psychological and technical mark of 1.4000. Below, near 1.3900, is the Tenkan line of the Ichimoku indicator. Thus, judging by the weekly timeframe, the correction may end near 1.4000 and 1.3900 and the pair will return to the upward dynamics. If so, then you can prepare for the purchases of the USD/CAD near the indicated prices. However, before opening long positions, it is better to enlist the support of the candle (and not only) signals at lower time intervals.
Daily
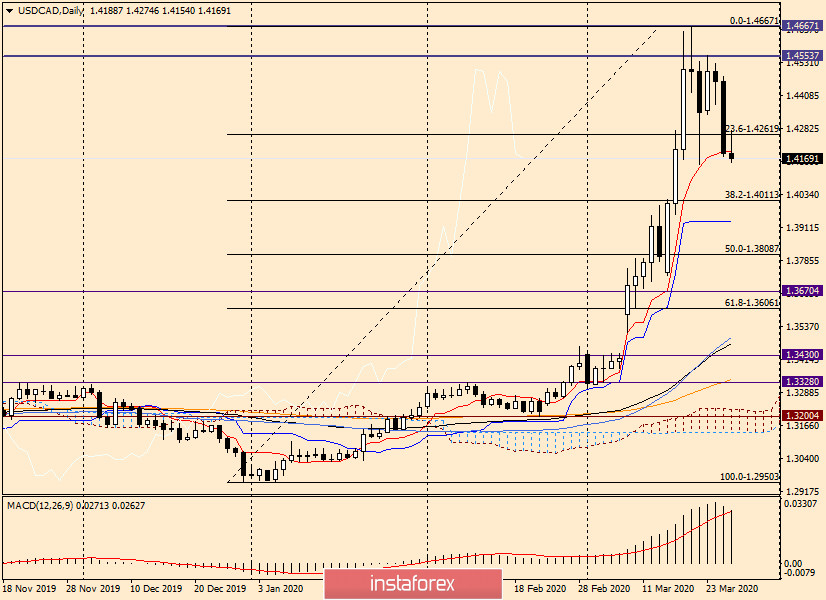
On this chart, we see that the pair declined quite decently and closed trading below the Tenkan line yesterday. This may indicate a continuation of the downward dynamics of the instrument.
This is what is observed at the end of the review. Attempts by bulls for USD/CAD to return the price above 23.6 Fibo were not successful, after which the quote turned down. In my opinion, the downward movement is likely to continue in the price zones of 1.4020-1.4000 and 1.3940-1.3900.
If bullish patterns of Japanese candles appear in the designated areas, this will be a signal to open long positions for USD/CAD. In the case of a rise to the area of 1.4550 and the appearance of bearish candle signals, you can try selling with the targets of 1.4500, 1.4420 and lower.
It is not yet clear whether this is a reversal or the pair is being corrected. I do not recommend opening positions without confirmation signals. Due to the spread of COVID-19 and the measures taken, including by the world's leading central banks, the situation on the foreign exchange market may change dramatically. This applies to all currency pairs with the US dollar. Be careful!
InstaForex analytical reviews will make you fully aware of market trends! Being an InstaForex client, you are provided with a large number of free services for efficient trading.

