 Stay
Stay 
Trading Conditions
Products
Tools


To open long positions on EURUSD, you need:
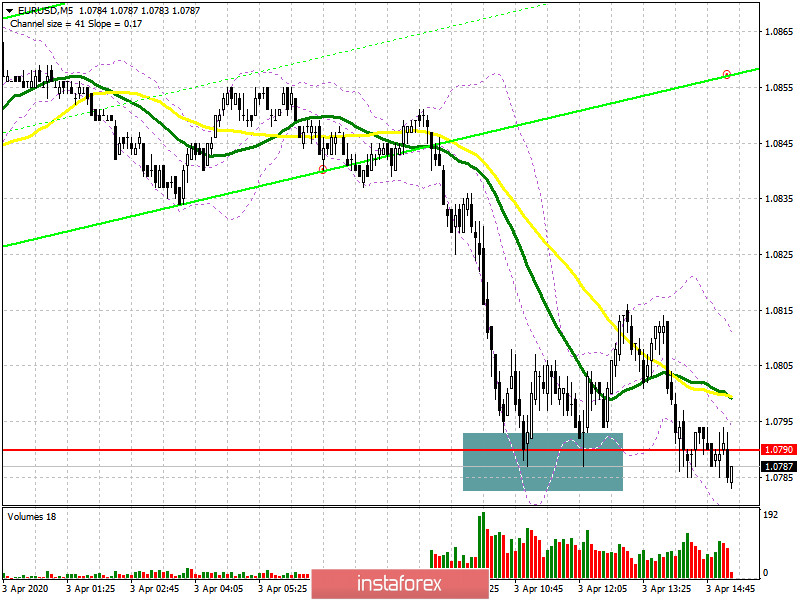
Another sale of the European currency after the publication of business activity indices for the services sector of the eurozone led the pair to the support of 1.0790. I paid attention to this in the morning forecast. The 5-minute chart clearly shows how the bulls try to form a false breakout, successfully making several bounces from this level, but each time they meet with larger sales. At the moment, the further movement of the euro down depends on the analysis of data on the labor market. It is unlikely that the bulls should expect the support of 1.0790, so it is best to return to long positions after updating the minimum of 1.0718, provided that a false breakout is formed there, or immediately to rebound from the annual support of 1.0626. In the scenario of the pair's growth in the second half of the day after the data on the state of the US economy, the bulls will try to regain the resistance of 1.0880, which will push EUR/USD even higher, to the maximum of 1.0955, where I recommend fixing the profits.
To open short positions on EURUSD, you need:
Sellers continue to follow a clearly defined plan, keeping the pair in a downward trend throughout the week. Several unsuccessful attempts to bounce back from the support of 1.0790 only strengthened the presence of major players in the market, who are counting on a further fall in the euro after the report on the state of the US labor market. A breakout of 1.0790 will definitely lead the pair to the lows of 1.0718 and 1.0636, where I recommend fixing the profits. If the data is not as bad as many economists expect, it is possible that the euro will rebound up to the resistance area of 1.0880, from where I recommend opening short positions after forming a false breakout. You can sell EURUSD immediately on a rebound today from the maximum of 1.0955.
Signals of indicators:
Moving averages
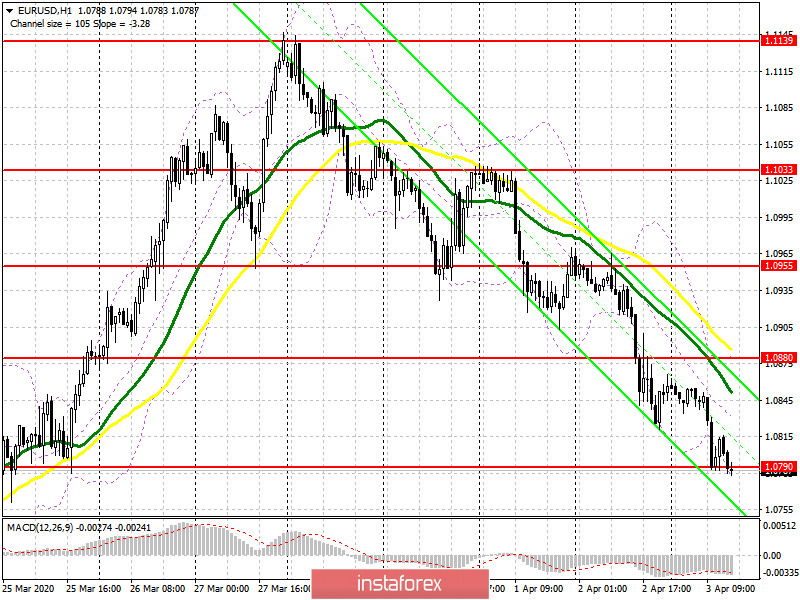
Trading is below the 30 and 50 daily moving averages, which indicates a further decline in the euro in the short term.
Note: The period and prices of moving averages are considered by the author on the hourly chart H1 and differ from the general definition of the classic daily moving averages on the daily chart D1.
Bollinger Bands
In the case of an upward correction in the second half of the day, the upper limit in the area of 1.0880 will act as a resistance.
Description of indicators
InstaForex analytical reviews will make you fully aware of market trends! Being an InstaForex client, you are provided with a large number of free services for efficient trading.


