 Stay
Stay 
Trading Conditions
Products
Tools


Thanks to the fundamental analysis, the pair moved down last week and tested the pullback level of 76.4% - 1.0767 (red dashed line). The price for the upcoming week from the level of 1.0801 (closing of the last weekly candle) may pull back up.
Trend analysis:
This week, the price may begin to move up with the target at 1.0860 - a pullback level of 23.6% (blue dashed line). Upon reaching this level, it is possible to continue working upwards with the target of 1.0915 - a pullback level of 38.2% (blue dashed line).
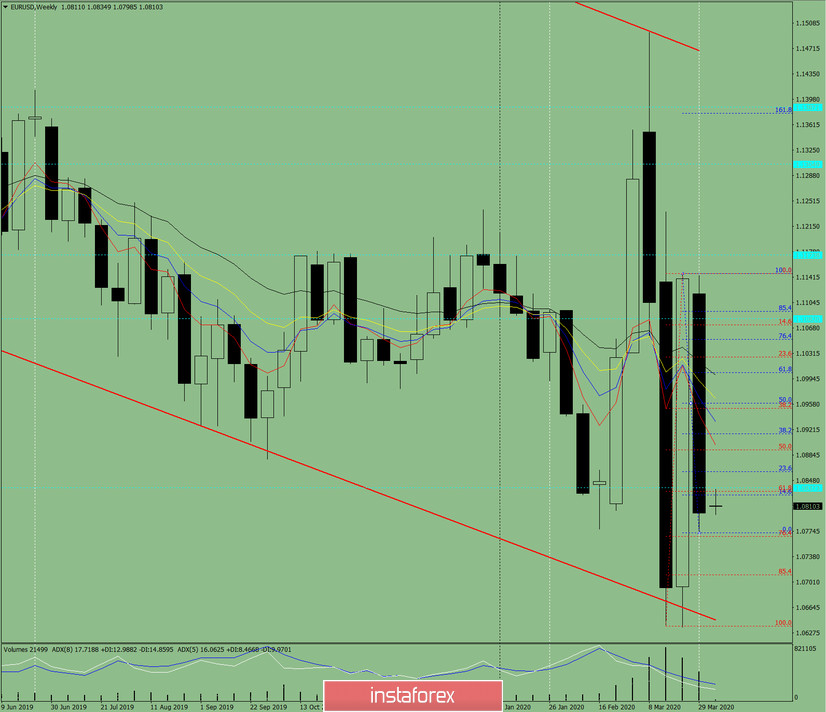
Fig. 1 (weekly schedule).
Comprehensive analysis:
- indicator analysis - up;
- Fibonacci levels - up;
- volumes - up;
- candlestick analysis - neutral;
- trend analysis - up;
- Bollinger Lines - up;
- monthly chart - up.
The conclusion of a comprehensive analysis is an upward movement.
The overall result of calculating the candle of the EUR/USD currency pair according to the weekly chart: the price of the week is likely to have an upward trend, with the absence of the first lower shadow of the weekly white candlestick (Monday - up) and the presence of the second upper shadow (Friday - down).
An unlikely scenario: from a pullback level of 14.6% - 1.0827 (blue dashed line), working down with a target of 1.0767 - a pullback level of 76.4% (red dashed line).
InstaForex analytical reviews will make you fully aware of market trends! Being an InstaForex client, you are provided with a large number of free services for efficient trading.

