 Stay
Stay 
Trading Conditions
Products
Tools


To open long positions on GBPUSD, you need:
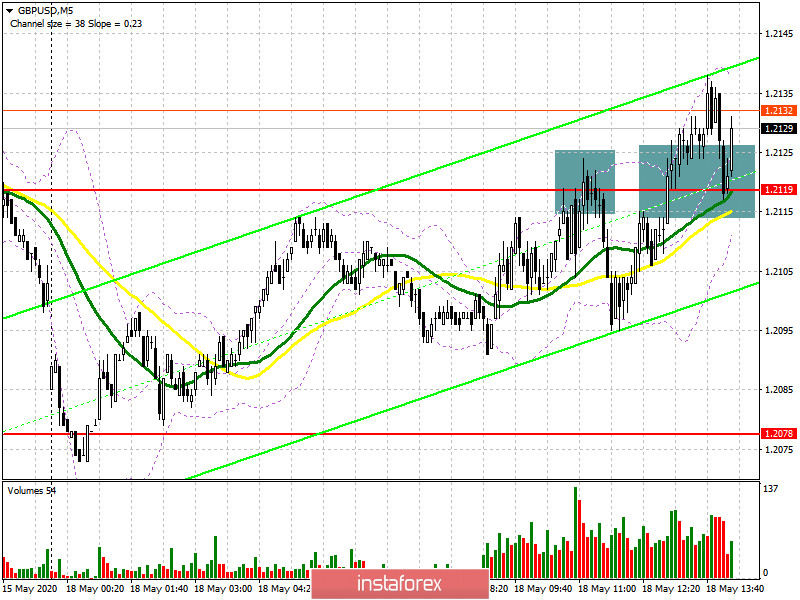
In the first half of the day, I paid attention to the possibility of an upward correction to the resistance area of 1.2119 and recommended opening short positions from it. If you look at the 5-minute chart, you will see how the bears at the first test of this area tried to return to the market, but more active sales than the movement of 30 points after the test did not occur. The gradual return of GBP/USD to this level closer to the middle of the day led to its breakdown and an attempt by the bulls to gain a foothold above the range of 1.2119. While trading is above this level, we can expect a continuation of the upward correction to the highs of 1.2170 and 1.2225, where I recommend fixing the profits. If the bears return the market under their control, and the trade moves under the area of 1.2119, it is best to postpone long positions until the update of larger lows in the area of 1.2030 and 1.1985, from where you can buy immediately for a rebound in the expectation of correction of 35-40 points within the day.
To open short positions on GBPUSD, you need:
Sellers of the pound need to return the pair to the level of 1.2119, which will quickly discourage bulls from opening new long positions. This scenario will allow us to count on the continuation of the bearish trend in order to reduce and update the lows of 1.2030 and 1.1985, where I recommend fixing the profits. If the bulls manage to push back from the support of 1.2119, above which they are now fixed, and also break through the moving averages, it is best to return to short positions only after updating the resistance of 1.2170 or sell GBP/USD immediately on a rebound from a larger maximum of 1.2225, based on a correction of 30-40 points within the day.
Signals of indicators:
Moving averages
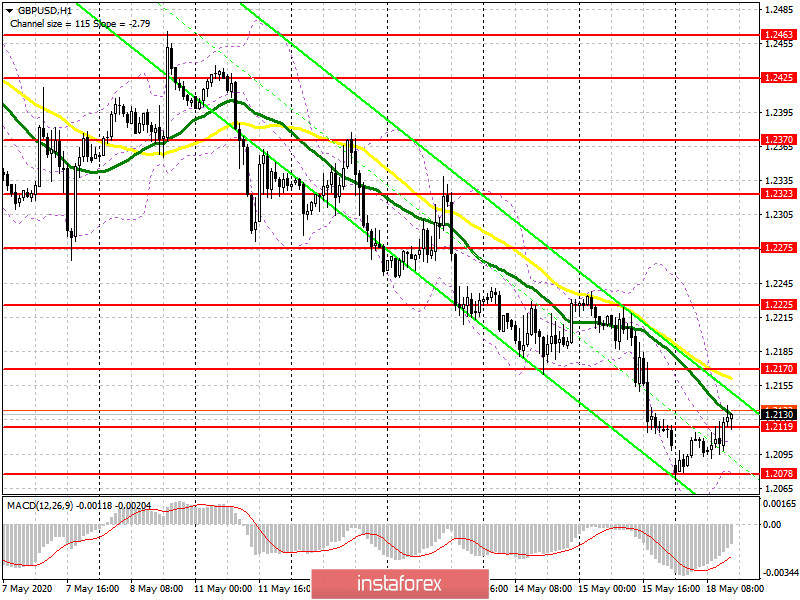
Trading is below the 30 and 50 daily averages, which indicates a continuation of the bearish trend.
Note: The period and prices of moving averages are considered by the author on the hourly chart H1 and differ from the general definition of the classic daily moving averages on the daily chart D1.
Bollinger Bands
A break in the lower border of the indicator at 1.2078 will increase the pressure on the pair, while a break in the upper border of the indicator at 1.2125 will lead to a new wave of growth.
Description of indicators
InstaForex analytical reviews will make you fully aware of market trends! Being an InstaForex client, you are provided with a large number of free services for efficient trading.


