 Stay
Stay 
Trading Conditions
Products
Tools


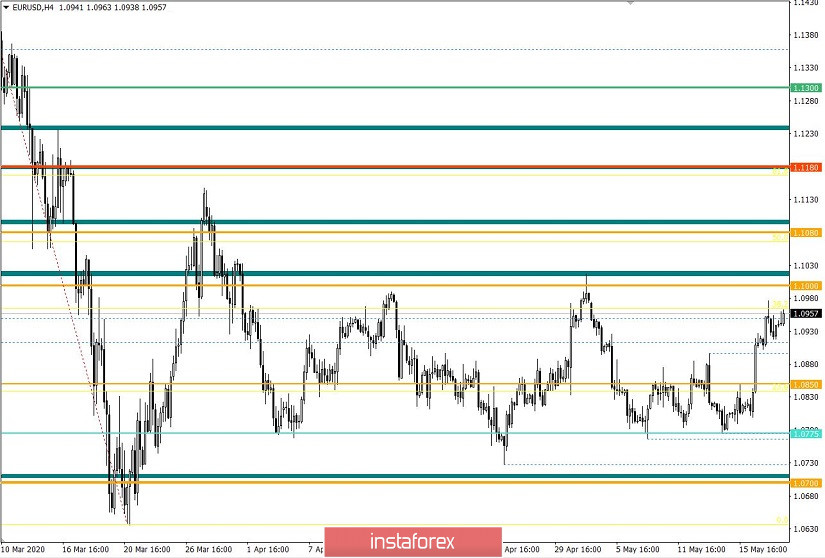
From the point of view of complex analysis, we can see that a local slowdown occurred after a rapid movement downwards. Yesterday's trading resumed the previous movement, but only managed about 70 points. Afterwards, a pullback arose, and then slowed down.
The flat in 1.0775 / 1.1000 has been formed for 1.5 months already. Before it, a compression occurred, which indicated the upcoming acceleration. Thus, the present compression of amplitudes led market participants to a sideways movement, possibly due to an impressive external background, which played on the emotional mood of market participants.
Taking this flat as a signal of change in the market tact is debatable. As long as the upper border of the flat stands, everything will continue indicating a downward medium-term move. In order to see a clear signal of a change in the medium-term course, the quote needs to overcome March's high at 1.1150. However, such an occasion is very unlikely, since the chances of holding the position of bulls are much higher than a breakout in the border of the flat.
When pursuing medium-term positions, do not forget about local operations, which currently bring significant income to traders.
Analyzing yesterday's trading by minutes, we can see that the round of long positions, which locally resumed the movement, occurred at the start of the European session.
As discussed in a previous review, market participants viewed the 1.1000 border as a level that would put pressure on market participants and resume a downward move. This process has somehow begun, but the concentration of quotes in the upper part of the flat remains in the market.
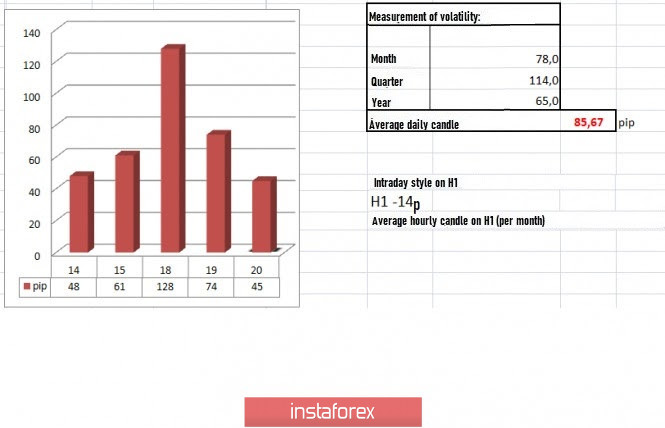
In terms of volatility, a 12% slowdown relative to the average daily indicator was recorded. Since the slowdown is still within the permissible rate of market activity, the figure is still considered as normal.
Analyzing the daily chart, we can see the frequency of fluctuations from the beginning of this year, which signals a strong impact on the market.
The news published yesterday contained data on the volume of construction in Europe, which recorded a 15% decline, the strongest observed in more than eight years. Said data is still an indicator for March, so subsequent figures promise to be terrible.
In the US, the data on construction was published in the afternoon, which revealed a 30.2% decrease in the volume of construction of new houses in April. Issued building permits also dropped by -20.8%.
Market participants remain unresponsive to such statistics.
Meanwhile, countries are beginning to gradually remove restrictive measures, but maintaned vigilance, due to the fears of a second wave of infections.
At the beginning of the week, France and Germany put forward a proposal to create a € 500 billion fund aimed to the post-crisis economic recovery of the European Union. However, so far, only an emergency package of employment support worth €100 billion has been approved.
Yesterday, US Secretary of Treasury Steven Mnuchin and Fed Chairman Jerome Powell faced the Senate Banking Committee, during which they reported on economic measures taken by the government in connection with the coronavirus.
Senators asked questions about what measures were taken to support the economy, as well as what mistakes were made when allocating previously approved anti-crisis packages.
The published interim forecast of the US Congressional Budget Office says that the efficiency of the US will decrease by 11% in the 2nd quarter [37.7% year on year] amid a loss of about 26 million jobs.
Data on inflation in Europe was published today, where a decrease from 0.7% to 0.3% was recorded, slightly lower than the forecasted 0.4%. Based on a preliminary assessment, the market is already ready for such figures, so market reaction is practically non-existent at the time of publication of the data.

Further development
Analyzing the current trading chart, we can see a local slowdown in the region of 1.0920 / 1.0965, which became a temporary refuge after a local rapprochement in the upper border of the main flat 1.0775 / 1.1000. Market participants will continue to focus in this 1.5-month corridor, which will lead to the completion of the boundaries set. The downward movement also remains to be the main goal of traders, but for it to conclude, the quotes need to overcome the level of 1.0775.
The upper limit of the main flat is due to pressure on market participants, which will lead to a consistent downward movement in the direction of 1.0775. Meanwhile, in the area of 1.0920 / 1.0965, local positions may be opened to trigger a breakout on the established boundaries.
Based on the information above, we derived these trading ideas:
- Consider buy positions above 1.0965, towards 1.0990.
- Consider selling positions below 1.0915, towards 1.0850-1.0775.
Indicator analysis
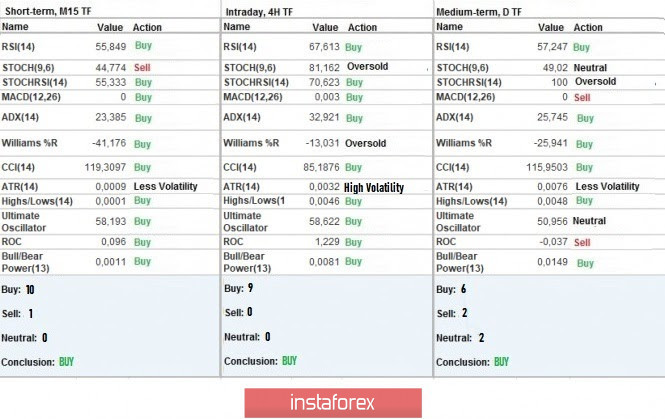
Analyzing the different sectors of timeframes (TF), we can see that the indicators of technical instruments signal a bullish mood, attributed to the concentration of trading forces in the upper limit of the flat.
Volatility per week / Measurement of volatility: Month; Quarter; Year
The measurement of volatility reflects the average daily fluctuation calculated by Month / Quarter / Year.
(May 20 was built, taking into account the time of publication of the article)
The current volatility is 45 points, which is 47% lower than the average daily value. The breakout of the variable corridor, inside the flat, will lead to a local burst of activity.
Key levels
Resistance zones: 1,1000 ***; 1.1080 **; 1,1180; 1.1300; 1.1440; 1.1550; 1.1650 *; 1.1720 **; 1.1850 **; 1,2100
Support areas: 1.0850 **; 1.0775 *; 1.0650 (1.0636); 1,0500 ***; 1.0350 **; 1,0000 ***.
* Periodic level
** Range Level
*** Psychological level
InstaForex analytical reviews will make you fully aware of market trends! Being an InstaForex client, you are provided with a large number of free services for efficient trading.

