 Stay
Stay 
Trading Conditions
Products
Tools


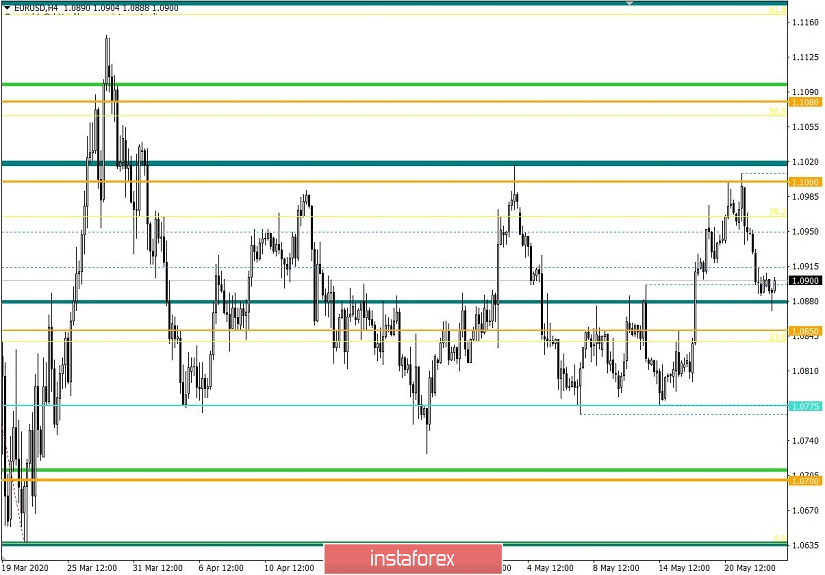
From the point of view of complex analysis, we can see the downward movement that occurred from the upper limit.
Last trading week surprised everyone with its dynamics. The quotes formed a channel from the lower border of the flat 1.0775 / 1.1000, after which it worked out the upper limit, forming a downward tact. The series of fluctuations that occurred after stretched the sideways channel to a seven-week scale, which made it unstable. The longer the flat lives, the higher is the chance of a breakout to occur.
The sideways channel is part of the fluctuations, with which all movement in general refers to the global downward trend.
Analyzing Friday's trading in detail, we can see that the bearish mood set by the market on Thursday remained, which pushed the quotes to consolidate below 1.0900.
Shorting the pair remains to be the main goal of traders, but in order for the plan to succeed, the quote needs to overcome at least the sideways channel 1.0775 / 1.1000, after which the goal will be the value 1.0700, which may update the historic lows.
As discussed in the previous review, traders worked on shorting the pair from the 1.1000 border. The movement occurred after the breakdown of May 20's low.
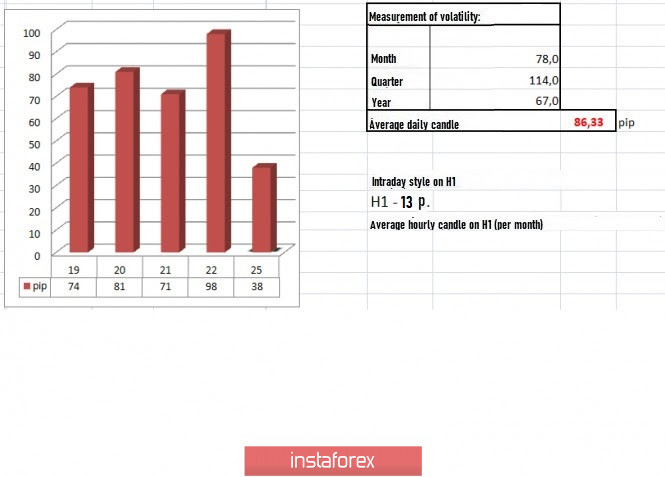
In terms of volatility, last week recorded consistently high activity indicators, averaging about 90 points. The dynamics of the GBP / USD pair also measured to 93 points last week, which indicates that the pair is in the acceleration phase.
Looking at the daily chart, we can see the regularity associated with the movements within the flat, with which fluctuations occurred regularly during the movement of the quotes from the border.
The news published last Friday did not contain any important statistics for Europe and the United States. The ECB published its minutes, which could have put pressure on the euro, but it was not affected. According to the report, the Governing Council of the ECB does not count on a V-shaped economic recovery after the coronavirus crisis, and revealed a change in the bond repurchase program.
"The Governing Council is fully prepared to increase the size and adjust the composition of the asset repurchase program, as well as other tools, if necessary," the document states.
Meanwhile, the final data on Germany's 1st quarter GDP was published today, where the forecasts coincided with the -2.3% decrease recorded. However, the market did not react to such weak statistics, as it already expected the low figure. The reduced trading volumes because of the US and UK day-offs also contributed to the non-reaction.
Further development
Analyzing the current trading chart, we can see a sluggish fluctuation within 40 points, where an attempt to resume the downward movement has been made, overcoming last Friday's lows. The quote found a variable support level relative to the average deviation of the side channel, but this is just temporary, since the movement has already set, and the descent to the lower boundary will occur soon.
A consolidation below 1.0870 will pretty much trigger a bearish mood, with which the variable level 1.0850 will no longer play any role in the market, and the quotes will continue to decline towards 1.0830-1.0775.
Based on the above information, we derived these trading recommendations:
- Traders have already placed sell positions from the value of 1.0950, towards 1.0775. If you do not have any deals, wait for the quotes to consolidate below 1.0870.
- Consider buying positions higher than 1.0920, targeting the level 1.0950.
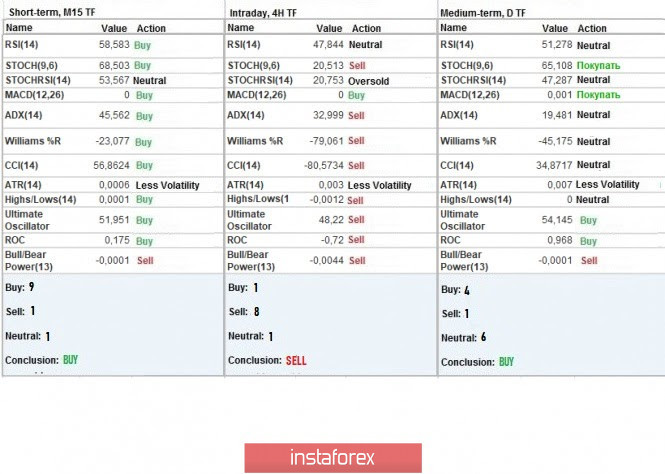
Indicator analysis
Analyzing the different sectors of time frames (TF), we can see that the indicators of the daily chart continue to work on an upward tact, but they are just tail ends, as indicated by neutral indicators. Meanwhile, the hourly charts have already taken a bearish mood, which is signaled by the rebound of quotes from the upper border of the flat.
Volatility per week / Measurement of volatility: Month; Quarter Year
The measurement of volatility reflects the average daily fluctuation calculated by Month / Quarter / Year.
(May 25 was built, taking into account the time of publication of the article)
Volatility is currently 38 points, which is still considered low, relative to the dynamics of the previous days. Because of scarce trading volumes, activity may be reduced.
Key levels
Resistance zones: 1,1000 ***; 1.1080 **; 1,1180; 1.1300; 1.1440; 1.1550; 1.1650 *; 1.1720 **; 1.1850 **; 1,2100
Support areas: 1.0850 **; 1.0775 *; 1.0650 (1.0636); 1,0500 ***; 1.0350 **; 1,0000 ***.
* Periodic level
** Range Level
*** Psychological level
InstaForex analytical reviews will make you fully aware of market trends! Being an InstaForex client, you are provided with a large number of free services for efficient trading.


