 Stay
Stay 
Trading Conditions
Products
Tools


To open long positions on EURUSD, you need:
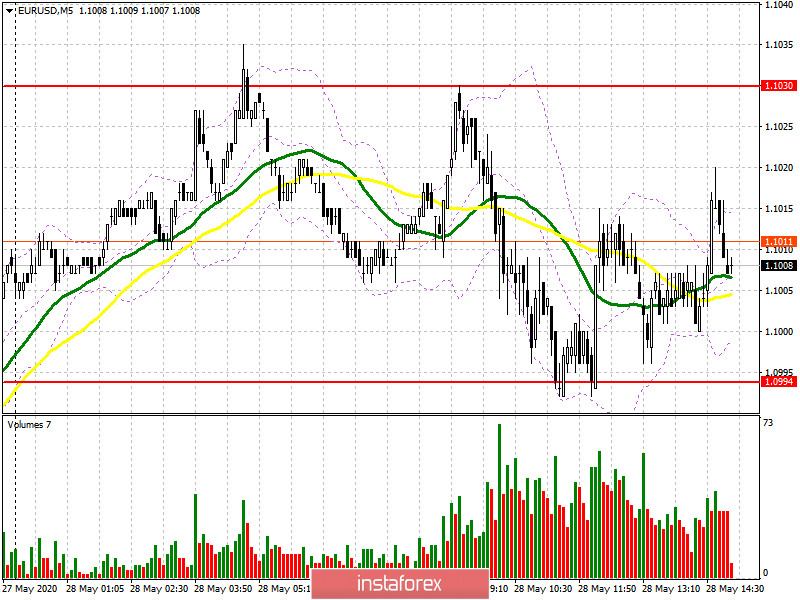
A weak report on German inflation, which slowed in may this year, put pressure on the euro in the first half of the day and did not allow buyers to get above the resistance of 1.1030, from which I recommended opening short positions in my morning review. If you look at the 5-minute chart, you will see how the test of 1.1030 led to a rapid movement of EUR/USD down to the support area of 1.0994, from which buyers began to act more actively. The formation of a false breakout at this level was a signal to open long positions in the euro. At the moment, as long as trading is above 1.0994, the demand for the euro will continue, which may lead to a repeated update of the maximum of 1.1030. Optimism among traders increased after yesterday's proposal by the European Commission to allocate an additional 750 billion euros to save the European Union's economies. A break in the range of 1.1030 will take place only after weak data on US GDP, which will open a direct road to the highs of 1.1063 and 1.1093, where I recommend fixing the profits. If the US GDP data for the 1st quarter of this year will be able to surprise with something good, then it is best to consider new long positions after updating the minimum of 1.0957 or buy EUR/USD immediately on the rebound from the larger support of 1.0917 with the aim of correcting 25-30 points by the end of the day.
To open short positions on EURUSD, you need:
From a technical point of view, nothing has changed. Traders only need good news on the next help plan, and whether it will be accepted or not is very important for the continuation of the bull market. All attention today in the second half of the day is shifted to the return and consolidation of the pair below the support of 1.0994, the first test of which has already taken place today in the European session. Only this will reduce the ardor of buyers and lead to a return of EUR/USD to the low of 1.0952, and then to the test of larger support of 1.0917, where I recommend fixing the profits. If the demand for the euro persists after the US GDP report, it is best to consider short positions only on the formation of a false breakout in the resistance area of 1.1030 or sell the euro immediately on a rebound from the maximum of 1.1063 with the aim of correcting by 20-30 points to the close of the day.
Signals of indicators:
Moving averages
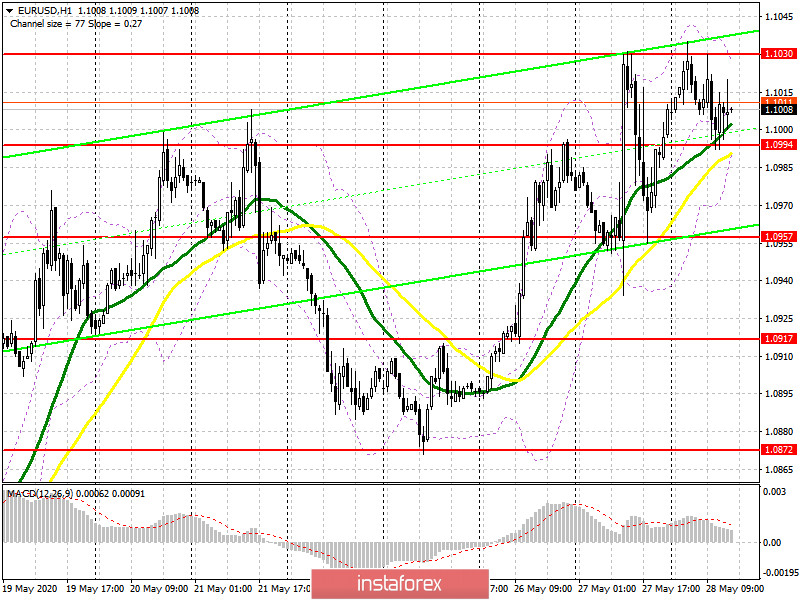
Trading is conducted above the 30 and 50 daily moving averages, which indicates the continuation of the bull market.
Note: The period and prices of moving averages are considered by the author on the hourly chart H1 and differ from the general definition of the classic daily moving averages on the daily chart D1.
Bollinger Bands
A break in the lower border of the indicator around 1.0994 will lead to increased pressure on the European currency. Breaking the upper limit of the indicator in the area of 1.1030 will lead to further growth of the euro.
Description of indicators
InstaForex analytical reviews will make you fully aware of market trends! Being an InstaForex client, you are provided with a large number of free services for efficient trading.

