 Stay
Stay 
Trading Conditions
Products
Tools


To open long positions on GBPUSD, you need:
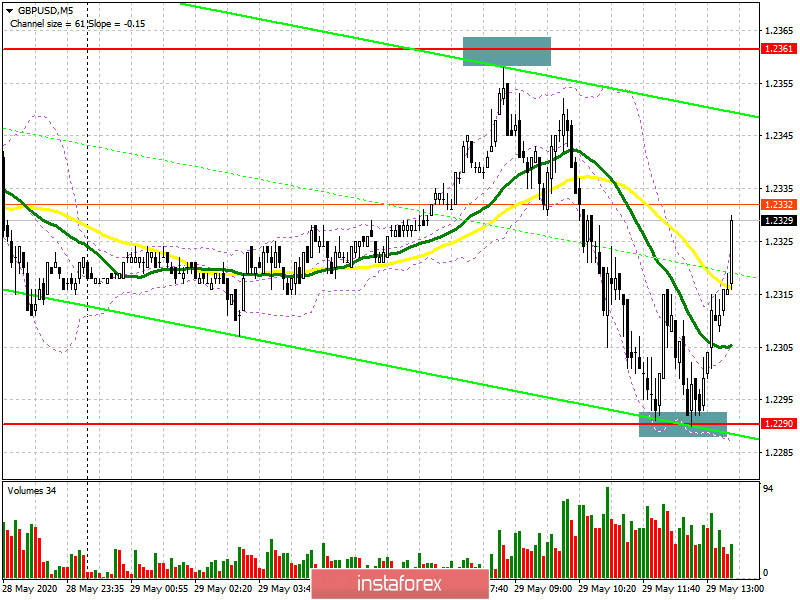
From a technical point of view, nothing changed in the first half of the day. And if you did not manage to sell the pound (and did everything correctly, there is no need to hurry) when approaching the resistance of 1.2361, which was just a couple of points short of the test, then you just had to act when updating the support of 1.2290, which I paid attention to in my morning forecast. Looking at the 5-minute chart, you can see how the bulls returned to the market after the repeated test of the minimum of 1.2290, which led to another upward wave in GBP/USD. At the moment, the task of buyers remains the same. A breakout and consolidation above this week's maximum in the area of 1.2361 will lead to a further major upward trend of GBP/USD, formed on May 15 this year with the update of the levels of 1.2423 and 1.2463, where I recommend fixing the profits. If the pressure on the pound returns in the second half of the day, I recommend considering new long positions only after another false breakout is formed in the area of 1.2290 or buy GBP/USD immediately on the rebound from the support of 1.2237, with the aim of an upward correction of 20-30 points at the end of this week.
To open short positions on GBPUSD, you need:
The task of sellers for the second half of the day is to form a false breakout in the area of this week's maximum, where the resistance of 1.2361 passes. However, this will happen only if there are good data on the level of income and spending of Americans, which should be better than the forecasts of economists. Only this will increase the pressure on the pound, but no less important task of the bears, which they failed to cope with in the first half of the day, is the return of GBP/USD to the support area of 1.2290 and its breakdown since only fixing below this range can lead to the formation of a new downward momentum that can break below the area of 1.2237. In the scenario of growth above the maximum of this week, it is best not to rush to open short positions but wait for the update of the levels of 1.2423 and 1.2463, where you can sell immediately for a rebound in the expectation of correction of 20-30 points at the end of the day.
Signals of indicators:
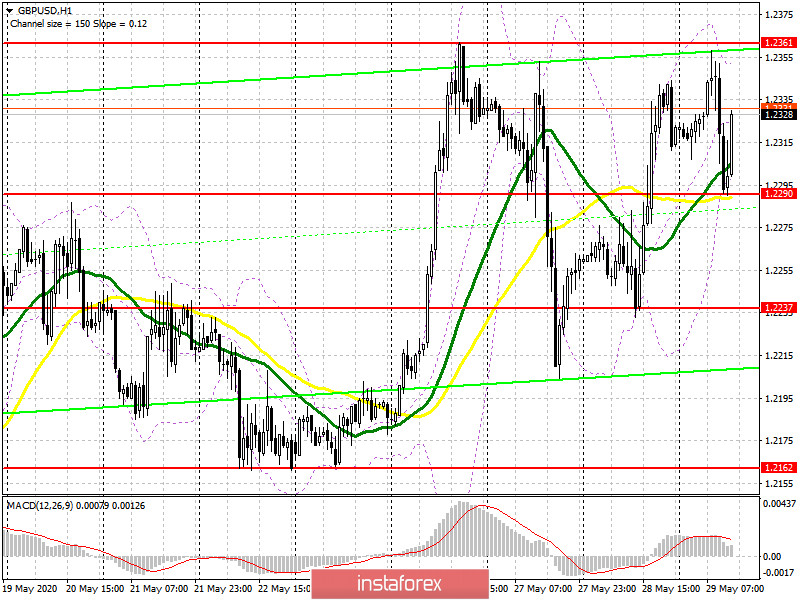
Moving averages
Trading is conducted in the area of 30 and 50 daily averages, which indicates an active confrontation between buyers and sellers.
Note: The period and prices of moving averages are considered by the author on the hourly chart H1 and differ from the general definition of the classic daily moving averages on the daily chart D1.
Bollinger Bands
A break in the lower border of the indicator at 1.2290 will increase pressure on the pair, while a break in the upper border of the indicator at 1.2355 will lead to a larger increase in the pound.
Description of indicators
InstaForex analytical reviews will make you fully aware of market trends! Being an InstaForex client, you are provided with a large number of free services for efficient trading.


