 Stay
Stay 
Trading Conditions
Products
Tools


The pair traded upwards on Thursday and almost tested 1.1371 - an 85.4% pullback level (presented in a blue dotted line). The news played an important role in such a strong upward movement. Today, the price may roll back down after testing the resistance line. Economic calendar news for the dollar is expected at 12:30 UTC.
Trend analysis (Fig. 1).
Today, the upward trend may continue from the level of 1.1340 (closing of yesterday's candle) with the target at resistance line 1.1380 (presented in a white bold line). The historical resistance level 1.1382 (presented in a blue dashed line) is also located there. It is very likely that from this cloud, the price may begin to move downwards with the first target of 1.1270 - a 14.6% retracement level (presented in a red dashed line).
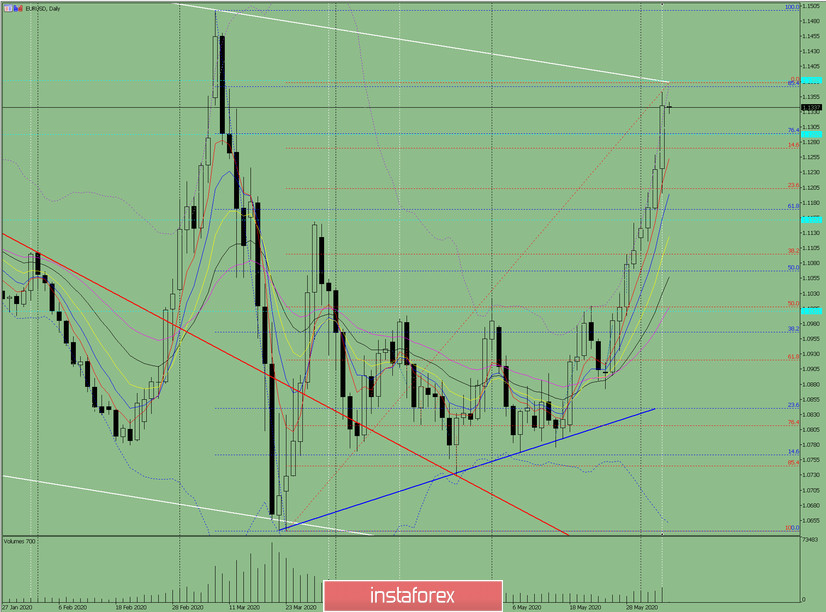
Fig. 1 (daily chart).
Comprehensive analysis:
- Indicator analysis - down;
- Fibonacci levels - up;
- Volumes - up;
- Candlestick analysis - down;
- Trend analysis - down;
- Bollinger Lines - down;
- Weekly schedule - up.
General conclusion:
Today, the price may continue to move upwards with the target at the resistance line 1.1380 (presented in a white bold line). From this level, the price may begin to move downwards with the first target of 1.1270 - a 14.6% retracement level (presented in a red dashed line).
Another possible scenario is an upward trend after breaking through the resistance line 1.1380 (presented in a white bold line) with the target at the upper fractal 1.1498 (presented in a blue dashed line).
InstaForex analytical reviews will make you fully aware of market trends! Being an InstaForex client, you are provided with a large number of free services for efficient trading.


