 Stay
Stay 
Trading Conditions
Products
Tools


Trading ideas to open long deals on GBP/USD
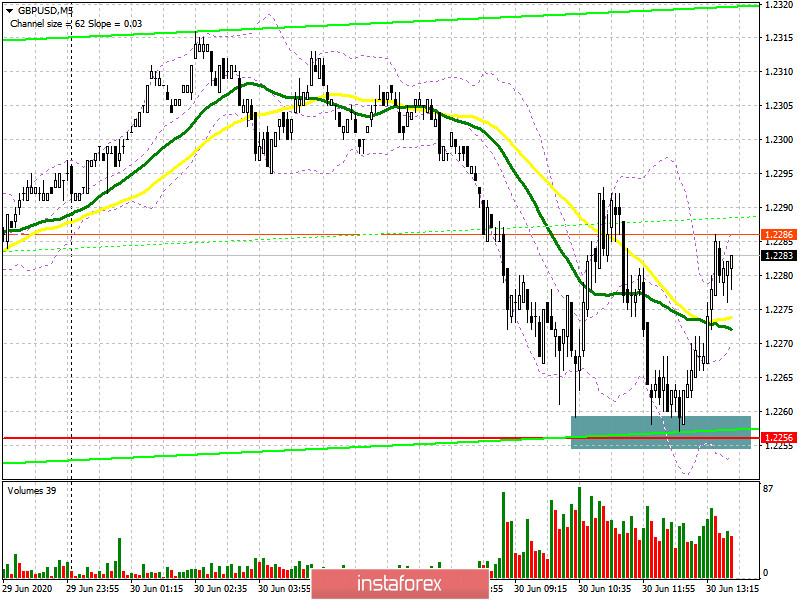
A downbeat report on the UK national economic output for Q1 destroyed the buyers' plans to develop an upward correction of the pound sterling. This pushed GBP/USD down again. In the first half of the trading day, I drew your attention to buying from 1.2256 on condition of a fake breakout. If you look carefully at the 5-minute chart, you see that the sterling was approaching the support level of 1.2256 immediately after the GDP report. Following the second wave, the bulls rushed to buy the sterling. So, the second wave became the market entry point for long positions. They make sense until 1.2256 is not breached. As long as the Cable is trading above 1.2256, I expect a correctional climb towards morning resistance at 1.2321. If it is broken, the buyers will get the second wind, enabling them to test the highs of 1.2386 and 1.2451 where I recommend taking profit. In case the Cable fails to develop an active climb from support at 1.2256 in the second half of the trading day, it would be better to give up long positions until the pair hits a new low after 1.2185. Alternatively, someone can buy GBP/USD immediately during a bounce from support at 1.2122, reckoning a 30-40 point correction in intraday trading.
Trading ideas to open short deals on GBP/USD
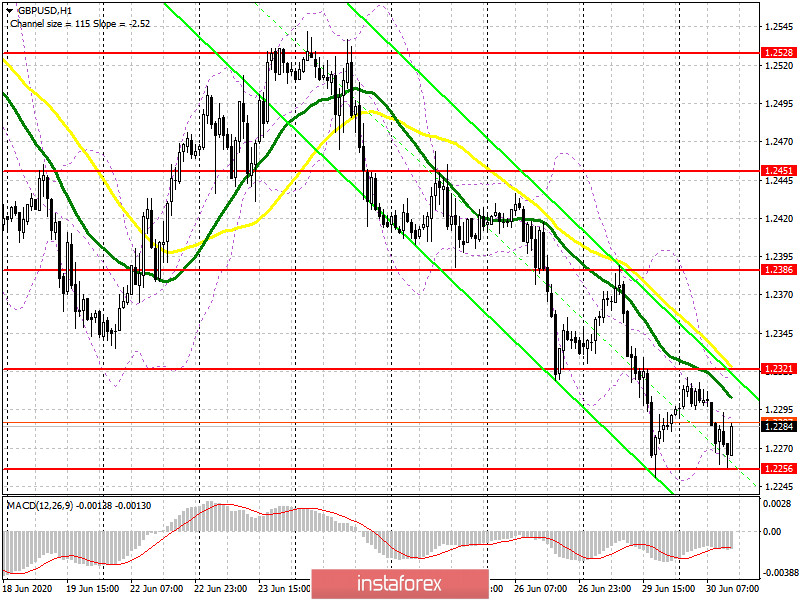
The technical picture looks the same for the sellers. A faint attempt of the bulls to enter the market from support of 1.2256 doesn't mean an important market move so far. The second test of this level accompanied by an upbeat US consumer sentiment index is sure to intensify the downtrend of GBP/USD. This will enable the pair to hit lower lows at near 1.2185 and 1.2122 where I recommend profit taking. However, if the bulls assert themselves in the second half of the day and don't allow the sterling to go under support of 1.2256 and if divergence on MACD remains the same, it would be better to cancel short positions on the Cable until the morning resistance of 1.2321 is refreshed. The price failed to reach that resistance in the first half of the day. Moving averages are also passing there. Alternatively, someone can sell GBP/USD immediately during a pullback from resistance of 1.2386, reckoning a 30-40 point correction in intraday trading.
Indicators' signals
Moving averages
The pair is trading below 30- and 50-period moving averages which serve as resistance for the bulls.
Remark. The author is analyzing a period and prices of moving averages on the 1-hour chart. So, it differs from the common definition of classic daily moving averages on the daily chart.
Bollinger Bands
In case the price breaks the lower border of Bollinger Bands at about 1.2256, the sterling will come under stronger pressure. If the pair doesn't develop a down move rapidly, you would rather give up selling the pair on lows.
Definitions of technical indicators
InstaForex analytical reviews will make you fully aware of market trends! Being an InstaForex client, you are provided with a large number of free services for efficient trading.


