 Stay
Stay 
Trading Conditions
Products
Tools


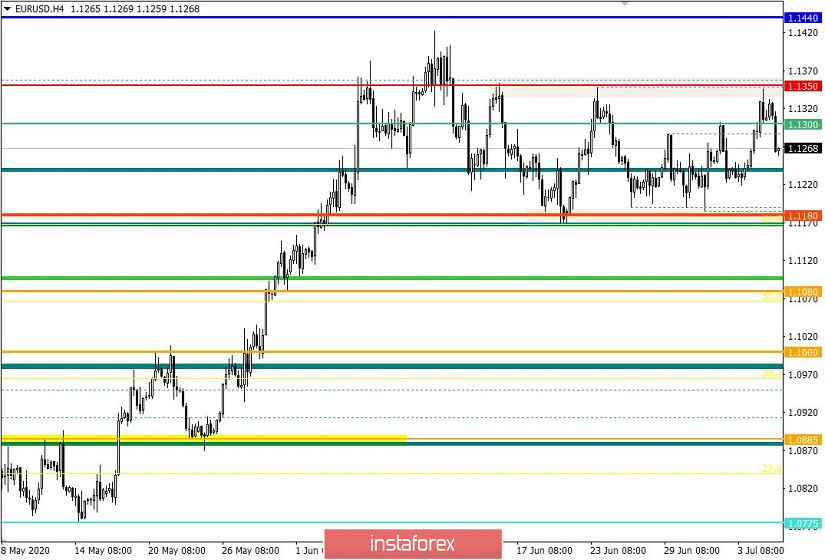
From the point of view of complex analysis, we can see the rise in speculative activity, which brought the quotes to the level of 1.1350.
Trading yesterday was full of speculation, which arose during the Asian session without the support of latest news and information background. Presumably, the activity was caused by a sharp decline in trading volumes last Friday, during which the quotes traded sideways, having a volatility of only 33 points. Thus, in yesterday's upward move, the quote managed to get closer to the level of 1.1350, which reflects the upper limit of the flat, as well as the resistance level where pressure usually arises and where a reversal may occur. A similar phenomenon with a rebound from the level of 1.1350 has already occurred three times earlier, in which since the start of the movement, the quotes have reached the area of interaction of trade forces five times. Most likely, this movement is just temporary, and has occurred because of the recent sideways movement of the prices. Nevertheless, the area of interaction of trade forces are at 1.1440 / 1.1500, which keeps the quotes from making major changes in the medium-term trend.
All this has led to new theories in market development. The channel 1.1180 // 1.1250 / 1.1350 could be the area that will prepare the market for a breakout from the area of interaction of trade forces 1.1440 / 1.1500, during which the fourth cycle of fluctuation within the area 1.1180 /// 1.1350 may trigger a large price movement.
Thus, we should prepare for any development in advance, and consider all possible theories in market development.
Anyhow, analyzing the trading conducted yesterday in detail, we can see that before the jump in speculative activity at 01:00 (UTC+1), an extremely interesting consolidation arose in the area 1.1235 / 1.1252, which lasted for 9 hours and made 50% of Doji candles. It was a signal for local positions, in which traders can enter the market through long positions. The most obvious consolidation was visible in the M15 TF.
Thus, for volatility, an acceleration of 215% relative to last Friday and 30% relative to the average daily value was recorded, perfectly reflecting the speculative mood in the market.
As discussed in the previous review, traders worked to trigger local leaps and movement around the value 1.1300 (1.1280 / 1.1305), at which strategies for a breakout were the most successful.
Analyzing the trading chart in general terms (daily period), we can see the sideways movement, the value of which resembles a variable platform instead of a full-fledged sideways movement.
As for news, the reports published yesterday included the data on the volume of retail sales in Europe, where the indicator in May grew by 17.8%, higher than the forecast of 15.0%. In annual terms, the decline slowed from -19.6% to -5.1%, which is much better than the forecast of -8.6%, encouraging the investors.
In the afternoon, the final data on the index of business activity in the services sector of the United States was published, in which a growth from 37.5 to 47.9 was recorded. The composite business activity index rose from 37.0 to 47.9, which ultimately helped to slightly adjust the quote in favor of the US dollar.
As for discussions on the recovery of the world economy, everyone is initially expecting a fast V-shaped pattern, but now are considering a different one. The president of Richmond Fed, Thomas Barkin, described the current situation of the economy as "a sharp descent down the elevator before going up on foot", in relation to which World Bank chief economist Carmen Reinhart advised everyone to be extremely careful especially with the findings, emphasizing the need to learn to distinguish between rebounds and economic recovery.
"Real recovery means that you are as wealthy as you were before the crisis, which I believe that we are far from it," Reinhart said.
A lot still depends on the situation with the coronavirus and vaccine development. Thus, monitoring the situation around the world remains the priority, as it will help see the sentiment of market participants.
Today, the data on JOLTS will be published, at which economists expect a decrease from 5,046 thousand to 4,500 thousand.

Further development
Analyzing the current trading chart, we can see a rapid downward surge, which occurred throughout the market yesterday. It reflected the turn in the channel 1.1180 // 1.1250 // 1.1350, wherein the test of the upper limit occurred not so long ago. Thus, holding the quotes inside the channel will remain in the market, which means that trading within its borders is still relevant.
With regards to market sentiment, speculative mood persists, due to which impulse jumps continue to occur.
Hence, the pair may move to the values 1.1235-1.1250, but if the quotes consolidate instead below the level of 1.1220, the pair will move to the lower limit of the channel which are 1.1180 / 1.1190.
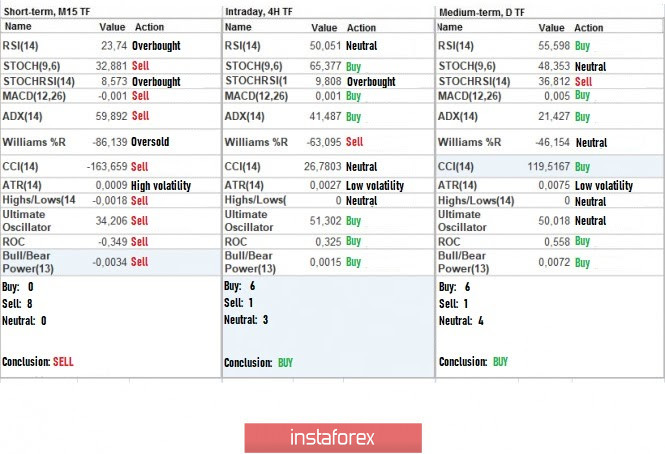
Indicator analysis
Analyzing the different sectors of time frames (TF), we can see that the indicators of technical tools in the hourly and daily periods show a buy signal, but everything may change if the quotes approach the level of 1.1220 / 1.1250.
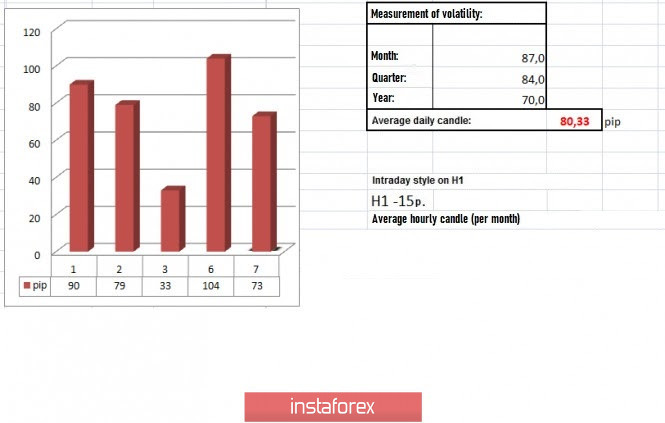
Volatility per week / Measurement of volatility: Month; Quarter; Year
The measurement of volatility reflects the average daily fluctuation calculated by Month / Quarter / Year.
(July 7 was built, taking into account the time the article is published)
The volatility in the current time is 73 points, which is almost the same as the average daily value. Hence, it is assumed that speculative mood will continue to pump activity into the market.
Key levels
Resistance Zones: 1.1300; 1.1440 / 1.1500; 1.1650 *; 1.1720 **; 1.1850 **; 1,2100
Support areas: 1.1180 **; 1.1080; 1,1000 ***; 1.0850 **; 1.0775 *; 1.0650 (1.0636); 1,0500 ***; 1.0350 **; 1,0000 ***.
* Periodic level
** Range Level
*** Psychological level
InstaForex analytical reviews will make you fully aware of market trends! Being an InstaForex client, you are provided with a large number of free services for efficient trading.


