 Stay
Stay 
Trading Conditions
Products
Tools


To open long positions on EURUSD, you need:
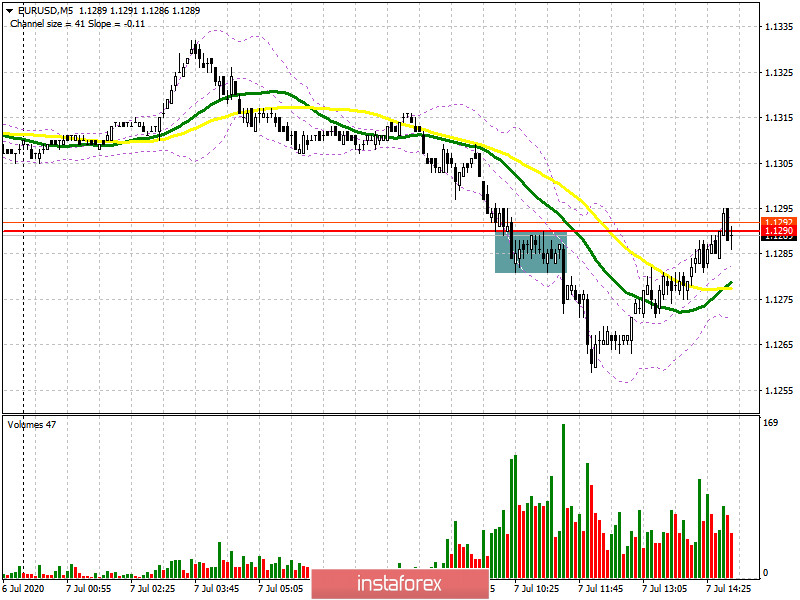
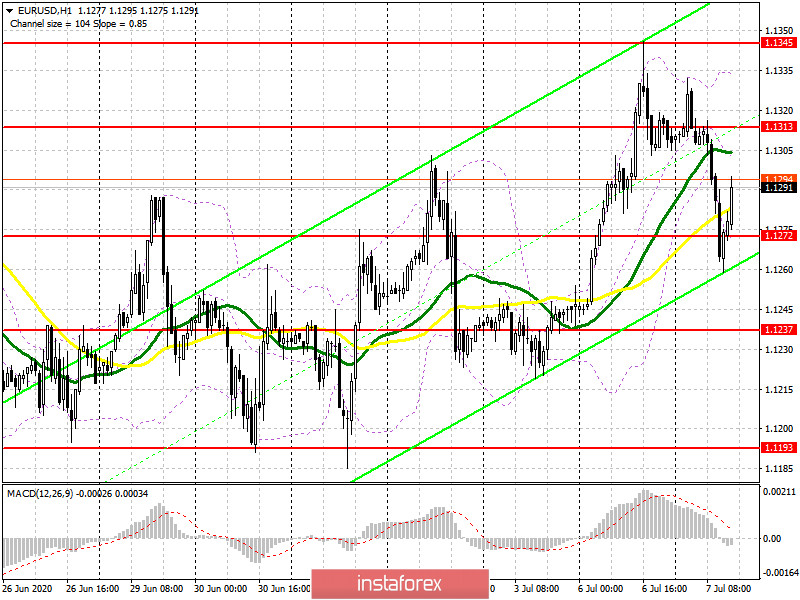
Pressure on the euro increased in the first half of the day after the growth rate of industrial production in Germany disappointed traders, and the European Commission revised down the pace of contraction of the Eurozone economies. If you look at the 5-minute chart and read my morning forecast, you will see how I recommended opening short positions after fixing below the support of 1.1290, which happened. After that, the downward movement was about 30 points. At the moment, the situation is radically different from what we saw in the morning. Bulls that are now trying to return to the market need to protect the support of 1.1272. Only the formation of a false breakout on it will be a signal to open long positions. However, a more important goal will be a breakout and consolidation above the resistance of 1.1313, which will only strengthen the bullish momentum and lead EUR/USD to the area of the weekly maximum of 1.1345, where I recommend fixing the profits. If you look at the hourly chart, you will see that despite the pair's downward movement, the bulls managed to form the lower border of the ascending channel. However, when the support breaks 1.1272, it is best to exit long positions and wait for the update of a larger minimum of 1.1237, where you can open long positions immediately on the rebound in the expectation of a correction of 20-25 points.
To open short positions on EURUSD, you need:
Sellers tried to return to the market, and now a lot depends on whether they will achieve a return of EUR/USD under the support of 1.1272 in the afternoon, or not. The speeches of representatives of the Federal Reserve System can support the US dollar, so fixing below the level of 1.1272 will be a signal to open short positions, similar to the morning entry, which will lead to a new sale of the euro in the area of the minimum of 1.1237, where I recommend fixing the profits. An equally important task will be the formation of a false breakout in the resistance area of 1.1313, which is now sought by buyers. If there is no activity at this level on the part of sellers, it is best to postpone short positions until the weekly maximum of 1.1345 is updated and sell the euro from there immediately on the rebound in the expectation of a correction of 25-30 points within the day.
Signals of indicators:
Moving averages
Trading is conducted around the 30 and 50 daily moving averages, which indicates problems for euro buyers who were unable to continue the bullish momentum.
Note: The period and prices of moving averages are considered by the author on the hourly chart H1 and differ from the general definition of the classic daily moving averages on the daily chart D1.
Bollinger Bands
If the euro rises in the second half of the day, you can open short positions immediately on the rebound from the upper limit of the indicator in the area of 1.1335.
Description of indicators
InstaForex analytical reviews will make you fully aware of market trends! Being an InstaForex client, you are provided with a large number of free services for efficient trading.


