 Stay
Stay 
Trading Conditions
Products
Tools


Hourly chart of the EUR/USD pair.
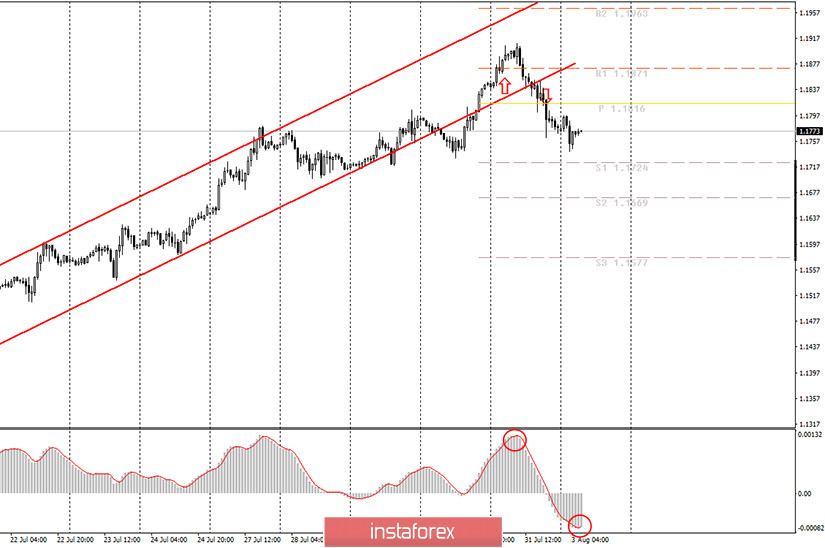
The EUR/USD currency pair returned to the ascending channel during the last trading day (last Friday), which showed its desire to resume the upward trend, but later resumed the downward movement and again left its limits. We talked about the fact that if the pair return to the channel, a possible new purchase. In principle, a few dozen points could be earned. The first MACD signal down, marked with a circle in the illustration, showed that the pair is again preparing for a downward movement. And after the quotes were again fixed at the end of the hour under the channel, it was possible to re-open short positions with the nearest goals. At the moment, new levels of support and resistance have been formed, which will only operate during today.
On Friday, novice traders should have paid attention to two important reports from the European Union. The first is GDP for the second quarter. Despite the fact that the value of this indicator was inconclusive, that is, it will still be corrected in the future, as practice shows, the final value is unlikely to differ much. Thus, -12.1% compared to the first quarter, this is the figure that we can rely on when analyzing the state of the EU economy at this time. We remind you that in the US, the GDP report showed a drop of 33% in the second quarter, that is, in fact, the economic crisis in the US is three times stronger than in Europe. Immediately everything falls into place. It is immediately obvious why the dollar has been falling in recent weeks. The second important report – the inflation report showed that this indicator accelerated slightly in July, which is a positive factor for the euro currency, as both the ECB and the Fed are aiming for 2% inflation. However, in general, traders did not react to these statistics, because technical factors remain in the first place. After such a long growth of the pair, a correction was necessary and, as we said earlier, on Fridays and Mondays, the markets often trade "against the trend". Based on all of the above, we believe that the downward correction may continue in the coming days. Moreover, there are no really important reports scheduled for Monday.
On August 3, the following scenarios are possible:
1) Purchases are no longer relevant, as the price has left the ascending channel. Thus, in order to trade the euro/dollar pair for an increase, new technical constructions are now needed (trend lines, channels, triangles, and others). Since none of this is currently available, we do not recommend buying the euro currency or doing so at your own risk. A reversal of the MACD indicator up (marked with the second circle) can give a buy signal with the goal of 1.1871.
2) Sales of the currency pair are now much more promising, but the same MACD indicator is preparing to turn up, which means that the pair can start an upward movement in the next few hours. Thus, for new sales of the pair with the goals of 1.1724 and 1.1669, we recommend waiting for the completion of this round of upward correction and using the new MACD signal to sell the pair down.
We also recommend that you familiarize yourself with the analysis, trading signals and analysis of transactions for the GBP/USD pair.
What's on the chart:
Price levels of support and resistance – levels that are targets when opening purchases or sales. You can place Take Profit levels near them.
Red lines – channels or trend lines that display the current trend and indicate which direction it is preferable to trade now.
Up/down arrows – show when you reach or overcome which obstacles you should trade up or down.
MACD indicator – a histogram and a signal line, the intersection of which is a signal to enter the market. It is recommended to use it in combination with trend lines (channels, trend lines).
Important speeches and reports (always contained in the news calendar) can greatly influence the movement of the currency pair. Therefore, during their exit, it is recommended to trade as carefully as possible or exit the market in order to avoid a sharp reversal of the price against the previous movement.
Beginners in the Forex market should remember that every trade cannot be profitable. The development of a clear strategy and money management are the key to success in trading over a long period of time.
InstaForex analytical reviews will make you fully aware of market trends! Being an InstaForex client, you are provided with a large number of free services for efficient trading.


