 Stay
Stay 
Trading Conditions
Products
Tools


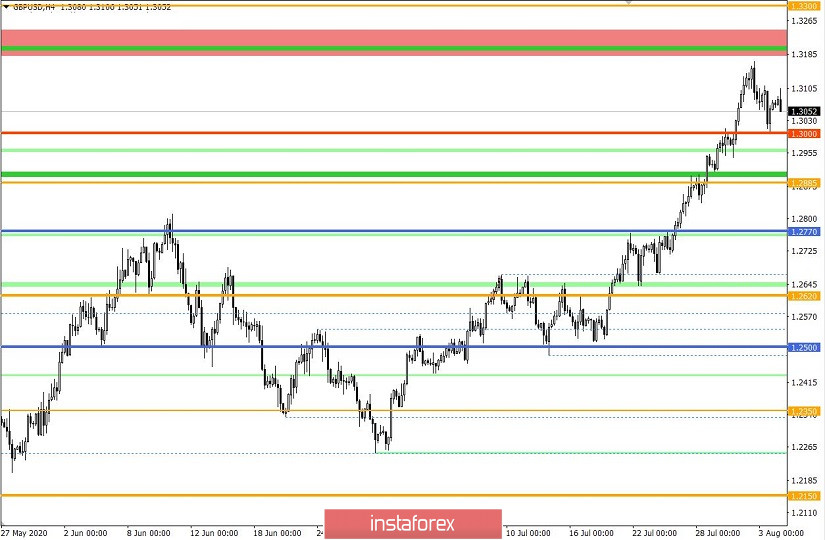
The pound/dollar currency pair, in the phase of a pullback from the local maximum of 1.3169, managed to return to the area of the psychological level of 1.3000, where a slowdown occurred on a systematic basis and, as a result, the price rebounded in the opposite direction.
In July, we had 165 points of pullback against 800 points of the inertial upward move, but there is no equilibrium. The overbought pound sterling is clearly visible, but this does not stop speculators. What is the reason?
The main motive for bullish positions lies in the cheap dollar, which has been losing ground for more than a month. Speculators seized on the topic of green paper sales, where the pound sterling plays the role of a bargaining chip, since its growth is contrary to common sense.
Regarding the technical model, an adjustment was made to the price ranges of fluctuations 1.2150 // 1.2350 // 1.2620 ----> 1.2770 // 1.3000 // 1.3300, where price fluctuations are made in the upper parts of the new range [1.3000/1.3300], which indicates the desire of speculators to keep long positions in the market.
When will the correction come? This is one of the main questions that worries traders. It is not so easy to answer it, but in terms of technical signals there are clear recommendations, price consolidation below 1.2950/1.3000 can lead to a cascade fixing of long positions and to a more impressive change in the value of the pound sterling. That is, we are talking about a change in fluctuations from the upper part of the range of 1.3000/1.3300 to the lower part of it 1.2770/1.3000.
Analyzing in detail the past day, we can see that the main round of short positions fell on the period 9:00-10:00 UTC+00, where the area of the psychological level was hit. Subsequent activity came to the market with the arrival of the Americans, where long positions appeared, which brought the quote back to the area of 1.3080.
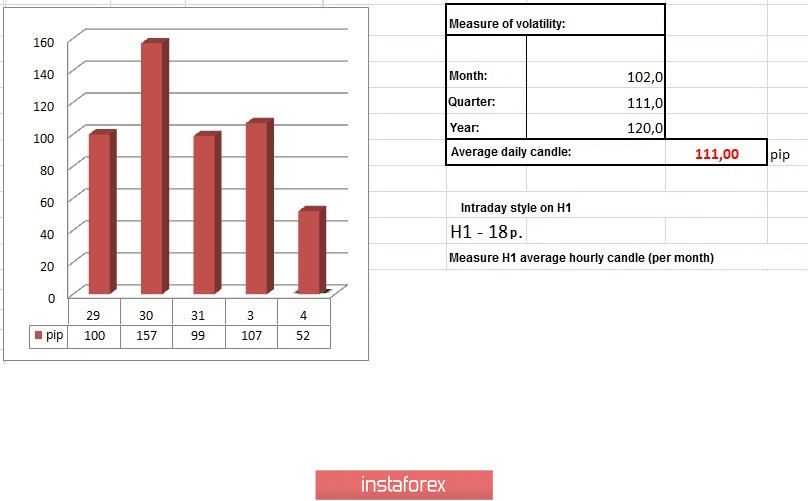
In terms of volatility, we see the indicator almost equal to the daily average (111 ---> 107 points), which indicates high market activity.
Let me remind you that based on the dynamics of the GBP/USD currency pair, we know that a reading above 100 points indicates that speculators are on the market.
Looking at the trading chart in general terms (daily period), you can see an intense upward trend in a four-week period, where the quote managed to reach a conditional maximum of 1.3169, where the first "Shooting Star" candlestick pattern was formed - 07/31/2020, which signals a possible reversal in the market. Relative to August 3, there is a Doji candlestick pattern, which signals indecision in the plan of actions of market participants, probably due to the rapid inertial movement in the period earlier.
The news background of the past day had an index of business activity in the UK manufacturing sector, where they recorded an increase from 50.1 points to 53.3 points. A similar indicator was released in the United States, where the PMI rose to 54.2p. in July against 52.6p. in the previous month.
These indicators reflect a gradual recovery of the economy, but the market did not think this was enough, and there was no reaction.
Today, in terms of the economic calendar, we only have data on the volumes of industrial orders in the United States, which reflect the total number of orders for durable and non-durable goods in the manufacturing sector. This allows us to assess the level of activity in this area, which is an important indicator of the state of the economy.
14:00 Universal time - Volume of industrial orders (m/m) (June): Prev. 8.0% ---> Forecast 5.0%
Further development
Analyzing the current trading chart, we can see a local surge in activity relative to the overnight stagnation [1.3060/1.3085], but as a result, the quote returned to the previous frame, as if signaling the possibility of a further downward move.
It is still too early to say whether there will be a correctional move, since it is necessary to return to the level of 1.3000, but the potential for this development is certainly available on the market.
Regarding the emotional state of the market, here, as before, a high speculative activity is recorded, which will make it possible to expand the scope of those who have fluctuations.
It can be assumed that if the quotes are kept below 1.3050, the way will open to us in the direction of 1.3000-1.2980. The most impressive price changes can be expected after price consolidates below 1.2950.
An alternative scenario is considered if the price consolidates above 1.3115, which may indicate a movement towards 1.3200.
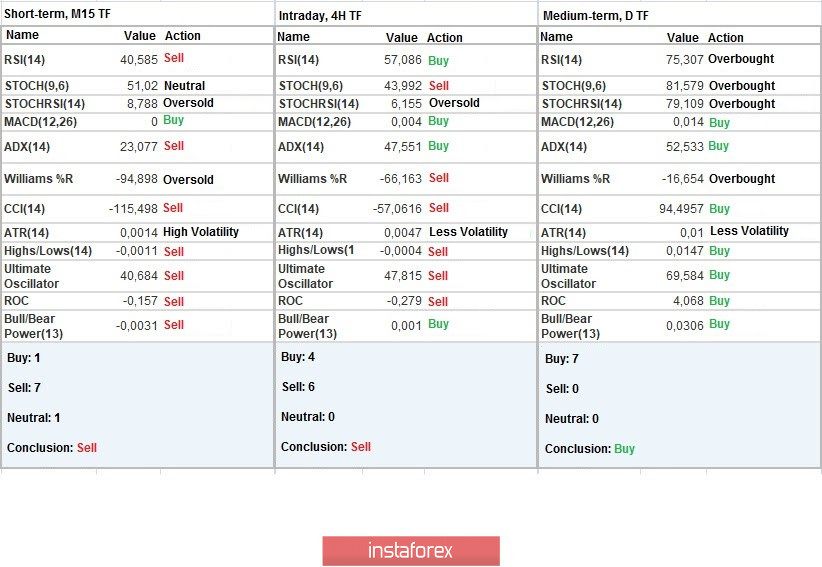
Indicator analysis
Analyzing different sectors of time frames (TF), we see that the indicators of technical instruments on minute and hourly intervals signal a sale due to the pullback process. In turn, daily intervals continue to signal an upward movement due to inertial movement.
Weekly volatility / Volatility measurement: Month; Quarter; Year
Measurement of volatility reflects the average daily fluctuation, calculated per Month / Quarter / Year.
(4 August was built taking into account the time of publication of the article)
The volatility of the current time is 52 points, which is 53% below the daily average. Speculative interest continues to put pressure on the market, which could lead to a volatility jump.
Key levels
Resistance zones: 1.3200 **; 1.3300 **; 1.3600; 1.3850; 1.4000 ***; 1.4350 **.
Support zones: 1.3000; 1.2885 *; 1.2770 **; 1.2620; 1.2500; 1.2350 **; 1.2250; 1.2150 **; 1.2000 *** (1.1957); 1.1850; 1.1660; 1.1450 (1.1411); 1.1300; 1.1000; 1.0800; 1.0500; 1.0000.
* Periodic level
** Range level
*** Psychological level
InstaForex analytical reviews will make you fully aware of market trends! Being an InstaForex client, you are provided with a large number of free services for efficient trading.

