 Stay
Stay 
Trading Conditions
Products
Tools


To open long positions on EURUSD, you need to:
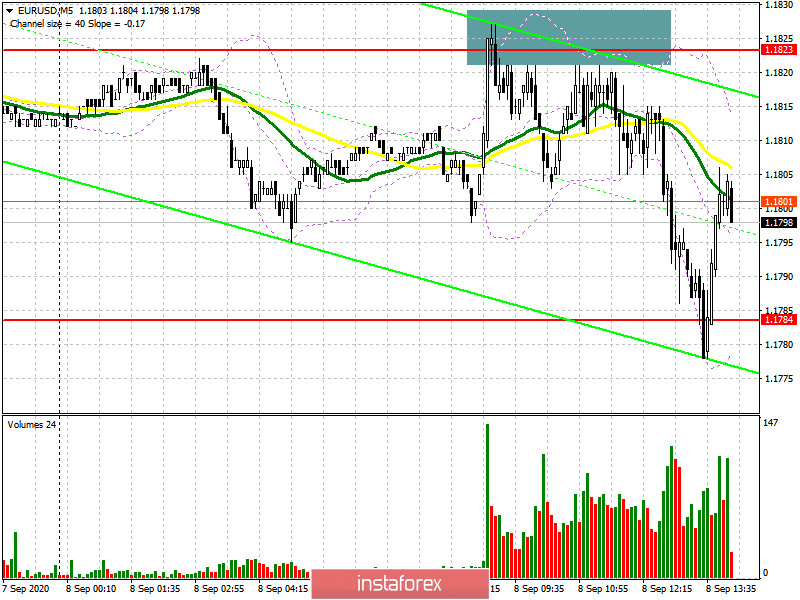
In the morning, the euro declined again due to the disappointing data on unemployment in the Eurozone. In my morning forecast, I paid attention to the probability of forming a false breakout at 1.1823 and recommended opening short positions from it, which happened. On the 5-minute chart, the bears protected the resistance of 1.1823, forming a great entry point from it. After that, there was a rapid decline in the euro to the support area of 1.1784, which is now being actively fought for. It was not possible to return the level of 1.1823 in the first half of the day and now the entire focus is shifted to the support of 1.1784. So far, the bulls have managed to form a false breakout there, which may lead to a second attempt to break the resistance of 1.1823. However, if there is no bull activity at this level closer to the beginning of the trading session, the fourth test of this range will likely lead to a breakdown. In this case, it is best to postpone long positions until the new low of 1.1750 is updated or buy EUR/USD immediately on a rebound from the larger support of 1.1714 in the expectation of correction of 20-30 points within the day. If the bulls manage to get above the resistance of 1.1823, then only fixing above this range will be a signal to open long positions in the expectation of a correction to the upper border of the side channel 1.1863, where I recommend fixing the profits. The longer-range target remains a maximum of 1.1906.
To open short positions on EURUSD, you need to:
As noted above, sellers achieved the formation of a false breakout at 1.1823, and also re-tested the support of 1.1784, which the bulls actively protect. In the second half of the day, a consolidation below 1.1784 will signal the opening of new short positions in the expectation of continuing the decline of the euro to a minimum of 1.1750. A more distant target will be the area of 1.1714, where I recommend fixing the profits. Given that important data is not published during the US session, the bulls may try to regain the level of 1.1823 again. It is best to open short positions from it only after forming a false breakout there, similar to the morning entry point, which I analyzed a little higher. If there is no activity at 1.1823, it is best to postpone sales until the upper limit of the side channel 1.1863 is tested or sell EUR/USD for a rebound from the maximum of 1.1905, based on a correction of 20-30 points within the day.
Signals of indicators:
Moving averages
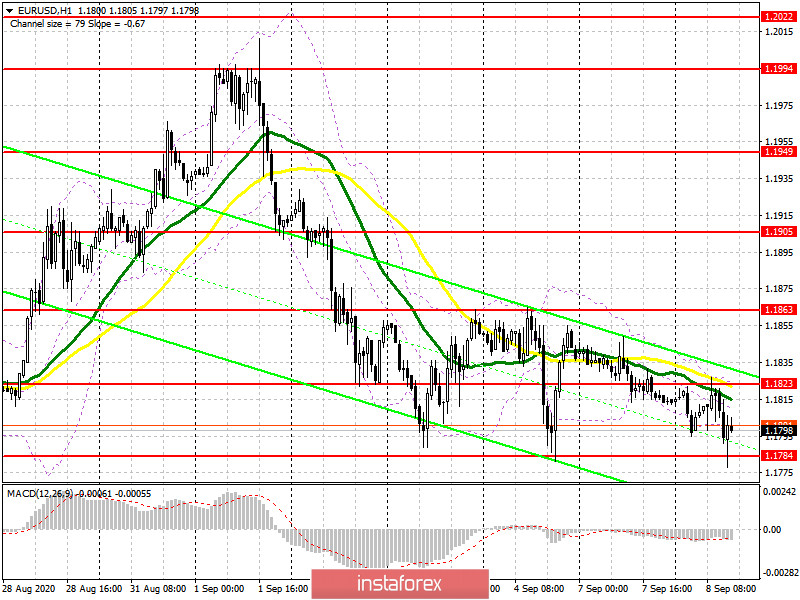
Trading is below the 30 and 50 daily moving averages, which indicates that the bears are trying to resume the downward correction of the market.
Note: The period and prices of moving averages are considered by the author on the H1 hourly chart and differ from the general definition of the classic daily moving averages on the D1 daily chart.
Bollinger Bands
A break in the lower limit of the indicator at 1.1800 will increase the pressure on the euro. A break in the upper limit of the indicator at 1.1823 will lead to an increase in the pair.
Description of indicators
InstaForex analytical reviews will make you fully aware of market trends! Being an InstaForex client, you are provided with a large number of free services for efficient trading.

