 Stay
Stay 
Trading Conditions
Products
Tools


Trend analysis.
This week, the price from the level of 1.1846 (closing of the last weekly candle) may continue to move upwards with the target at 1.1917 - upper fractal (weekly candle from 09/06/2020). If you test this level, you can continue working up with the goal of 1.2010 - the next upper fractal (red dotted line). A pullback is possible from this line.
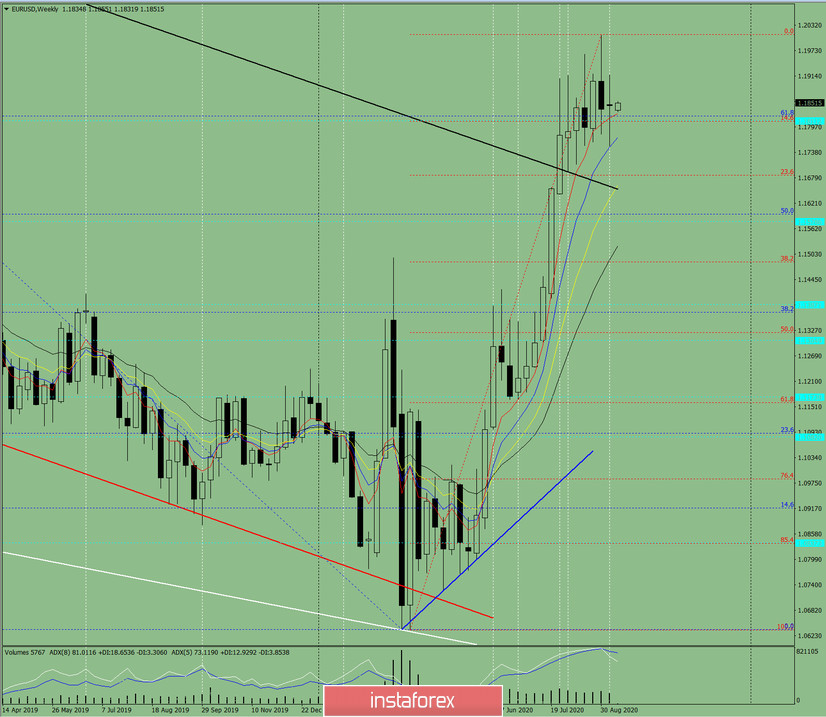
Figure: 1 (weekly chart).
Comprehensive analysis:
- indicator analysis - up;
- Fibonacci levels - up;
- volumes - up;
- candlestick analysis - neutral;
- trend analysis - up;
- Bollinger lines - up;
- monthly chart - up.
An upward movement can be concluded based on comprehensive analysis.
The general result of calculating the candlestick of the EUR/USD pair according to the weekly chart: the price this week is likely to have an upward trend, with no lower shadow in the weekly white candlestick (Monday - up) and the presence of a lower shadow (Friday - down).
The first upper target is 1.1917 - the upper fractal (weekly candle from 09/06/2020). If this level is tested, we can continue to work upwards with the target at 1.2010 - the next upper fractal (red dotted line).
An unlikely scenario: when moving up and reaching the upper fractal 1.1917 (weekly candle from 09/06/2020), the price is unlikely to start working down, with the target at 1.1685 - a pullback level of 23.6% (red dotted line).
InstaForex analytical reviews will make you fully aware of market trends! Being an InstaForex client, you are provided with a large number of free services for efficient trading.

