 Stay
Stay 
Trading Conditions
Products
Tools


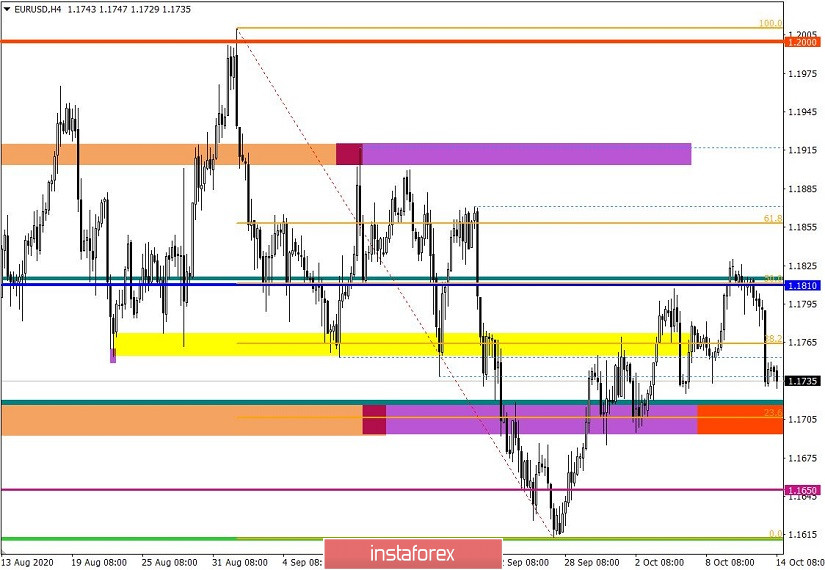
Yesterday, the EUR/USD pair showed high activity, as a result of which the area of 1.1800/1.1830 was worked out as a resistance level. In fact, we did not get price surges, but also a real chance of restoring downward interest and most importantly, an opportunity to complete the process of a long-term correction.
Now, we should be very careful, as the correction brought a lot of problems to sellers, and the price return to the borders of the previously passed side channel 1.1700/1.1810/1.1910 is considered not the best signal for a downward development. However, the lower border of the flat (1.1700) is no longer considered to be something impassable, and sellers still have a chance to restore the descending cycle set in September. In this case, a price consolidation below 1.1690/1.1700 in a four-hour (H4) period can be a good signal for the resumption of downward interest.
Analyzing yesterday's fifteen-minute period, you can see that the main round of acceleration fell on the start of the American session and lasted only a few hours (12:30-15:45 UTC+00). During the allotted time, we received a local inertial course and a minimum value of 1.1731. The subsequent fluctuation was expressed in stagnation, with an amplitude of less than 20 points. It is worth noting that the current slowdown coincides with the area of local interaction of trade forces last week (October 7 and 8). This means that the market has come to the area of the lower border of the previously passed flat 1.1700/1.1810/1.1910, which affects the volume of short positions.
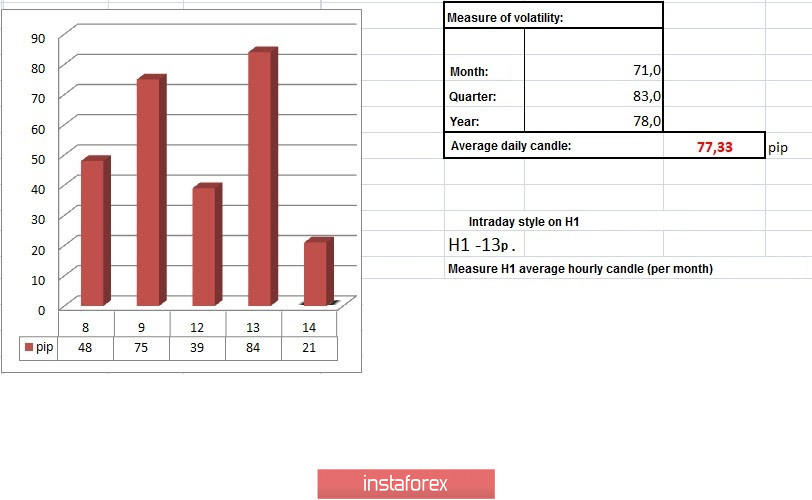
In terms of daily dynamics, the highest indicator for 6 trading days was recorded yesterday. It amounted to 84 points, which is 8% higher than the average. The surge in activity was expected based on the natural basis of the sharp slowdown last October 12, where an unusual low indicator of daily activity of 39 points was recorded.
As discussed in the previous analytical review, traders were ready to accelerate based on the natural basis of the past, so the work was carried out based on the price fixing points relative to the stagnation in the range of 1.1800/1.1830. In this case, holding the price below 1.1800 indicated a prevailing downward interest. The recommendation of October 13 coincided 100%.
Looking at the trading chart in General terms (daily period), you can see that the current recovery process is ~ 46% relative to the correction, which is the most impressive attempt to restore downward interest during the correction so far.
For the news background, a report on US inflation for September was published yesterday, where growth from 1.3% to 1.4% is recorded. Consumer prices, although they did not rise to the forecasted 1.5%, still rose, which may reduce the risks of possible fears about the prospects of any easing of the Fed's monetary policy.
In terms of the information background, we see that the media continues to discuss the second wave of pandemic, where Europe is now on the verge of more and more restrictive measures, which complicates the situation with long positions in the euro.
At the same time, the negotiations on the Brexit process are coming to an end, and there is still no result. German Minister for European Affairs, Michael Roth, said at a recent press conference that the negotiations are at a critical stage.
In addition, he noted that a tough Brexit will be very bad news for everyone in the EU, but even worse for the UK. All this will happen against the backdrop of a serious economic decline over several decades.
As we can see from the above material, Brexit and COVID-19 have strong pressure on the European currency and speculators can take advantage of this situation at any time.
In terms of the economic calendar, we have data on industrial production in Europe today, where a slowdown in the decline from -7.7% to -7.2% is expected, but the decline has such a prolonged period that it is unlikely that this news will somehow have a positive effect. to the Euro.
In the afternoon, we expect US producer prices data, where the decline may be replaced by an increase of 0.4%, which will positively affect the US dollar.
Further development
Analyzing the current trading chart, you can see that the stagnation during the Asian session was replaced by another round of decline, where yesterday's local low was updated - 1.1731. Now, the main thing is not that there is an update of the lowl, but that the recovery process is still on top.
Traders need to consolidate below 1.1690/1.1700 on the four-hour (H4) period. In this case, we will get a clear signal of the prevailing downward interest.
Based on the obtained data, we should wait for the price to consolidate below 1.1690/1.1700, so as not to run into the natural price rebound from the lower border of the flat 1.1700/1.1810/1.1910.
Based on the above information, we will display trading recommendations:
- Consider sell deals if the price consolidates below 1.1690/1.1700 on a four-hour (H4) period, with the prospect of moving to 1.1660-1.1625
- Consider buy deals in case of a regular price rebound, where it is best to enter a trade above 1.1755, towards 1.1785-1.1800.
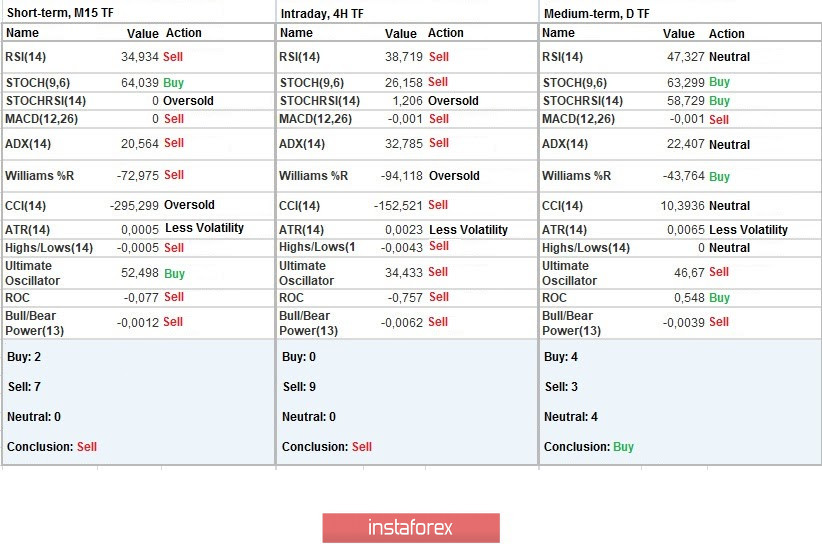
Indicator analysis
Analyzing different sectors of timeframes (TF), we see that the hourly and minute TFs have a sell signal due to the recovery process. In turn, the daily TF has a buy signal, but if the price consolidates below 1.1700, a sell signal will appear again.
Weekly volatility / Volatility measurement: Month; Quarter; Year
The volatility measurement reflects the average daily fluctuations, calculated per Month / Quarter / Year.
(It was built considering the publication time of the article)
The current time volatility is 21 pips, which is 72% below the average. If the level of 1.1700 breaks down, acceleration may occur which is expected by many traders.
Key levels
Resistance zones: 1.1810; 1.1910; 1.2000 ***; 1.2100 *; 1.2450 **; 1.2550; 1.2825
Support zones: 1.1700; 1.1650 *; 1.1500; 1.1350; 1.1250 *; 1.1180 **; 1.1080; 1.1000 ***.
* Periodic level
** Range level
*** Psychological level
InstaForex analytical reviews will make you fully aware of market trends! Being an InstaForex client, you are provided with a large number of free services for efficient trading.


