 Stay
Stay 
Trading Conditions
Products
Tools


The pair moved in a side channel yesterday. Moving down, the price tested the pullback level of 50% - 1.1723 (blue dotted line), and then the market went up testing the upper pullback level of 38.2% - 1.1766 (red dotted line). Today, the economic calendar news is expected at 16.00 UCT (Euro), 12.30 and 15.00 UCT (dollar). It is possible to continue working down.
Trend analysis (Fig. 1).
Today, the market from the level of - 1.1748 (closing yesterday's daily candle) can continue to move down with the goal of 1.1723 - a pullback level of 50.0% (blue dotted line). When testing this level, the price will further work down with the goal of 1.1697 - a pullback level of 61.8% (blue dotted line).
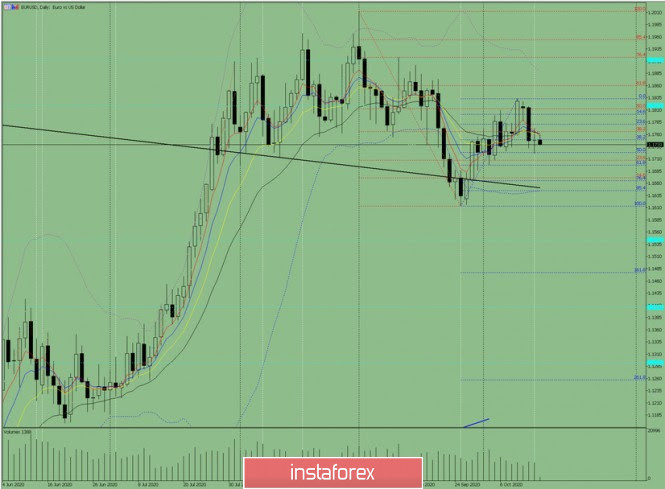
Figure 1 (daily chart).
Complex Analysis:
General conclusion:
Today, the market from the level of 1.1748 (closing yesterday's daily candle) can continue to move down with the goal of 1.1723 - a pullback level of 50.0% (blue dotted line). When testing this level, the price will further work down with the goal of 1.1697 - a rollback level of 61.8% (blue dotted line).
Alternative scenario: from the level of 1.1748 (closing of yesterday's daily candle), the price may continue to move down with the goal of 1.1723 - a pullback level of 50.0% (blue dotted line). When testing this level, the price will further work down with the goal of 1.1766 - a pullback level of 38.2% (red dotted line).
InstaForex analytical reviews will make you fully aware of market trends! Being an InstaForex client, you are provided with a large number of free services for efficient trading.

