 Stay
Stay 
Trading Conditions
Products
Tools


GBP/USD 1H
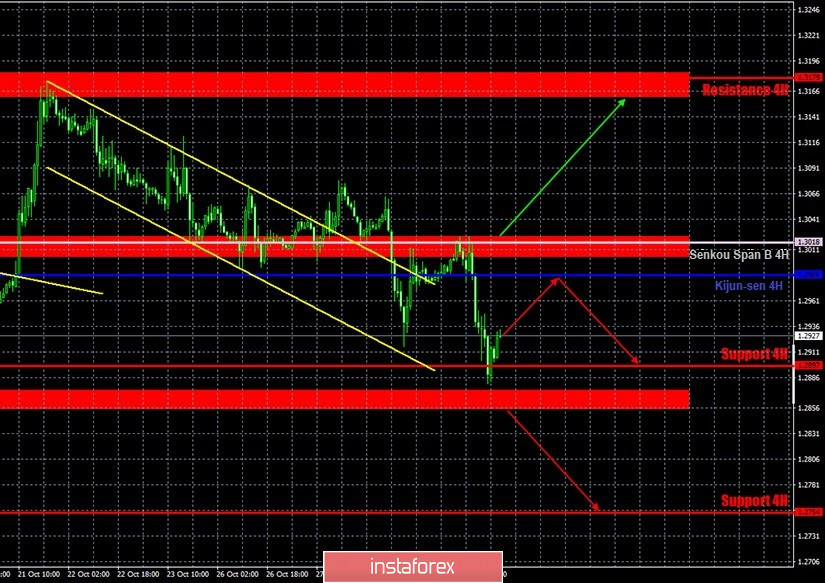
The GBP/USD pair was also trading lower for most of the day on Thursday, October 29. The pair perfectly rebounded from the Senkou Span B line in the morning, thereby forming a sell signal. It fell to the support level of 1.2897 during the day. Therefore, the downward trend remains in effect despite the fact that the price left the descending trend channel earlier. Now bears need to overcome the support area of 1.2854-1.2874 to build on their own success. In this case, they will be able to pull down the pair by another 100 points. Buyers only have to wait until they return to the important Kijun-sen and Senkou Span B lines. We can only expect the pair to return to the upward channel above these lines. However, according to fundamental analysis, this option is unlikely in the near future.
GBP/USD 15M
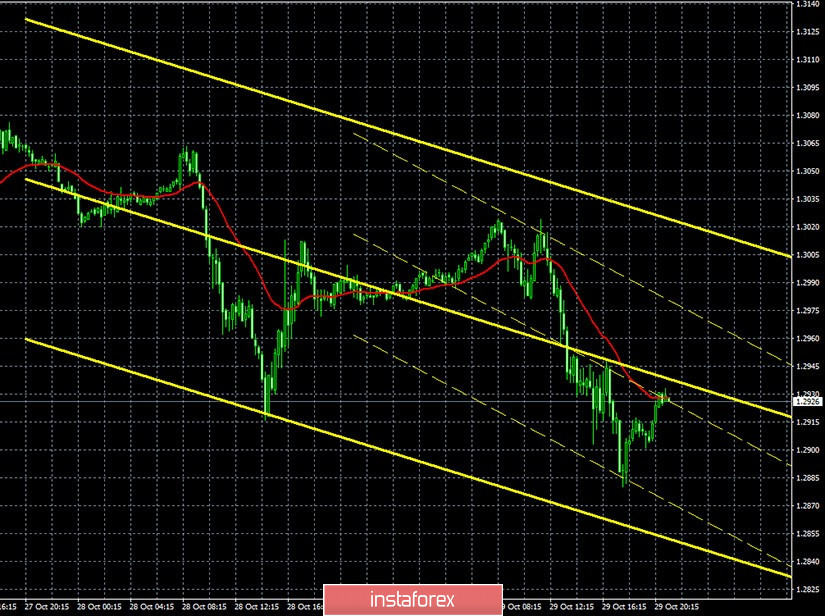
Both linear regression channels are directed downward on the 15-minute timeframe, which reflects the trend of the last two days. There are no signs of starting an upward correction at the moment.
COT report
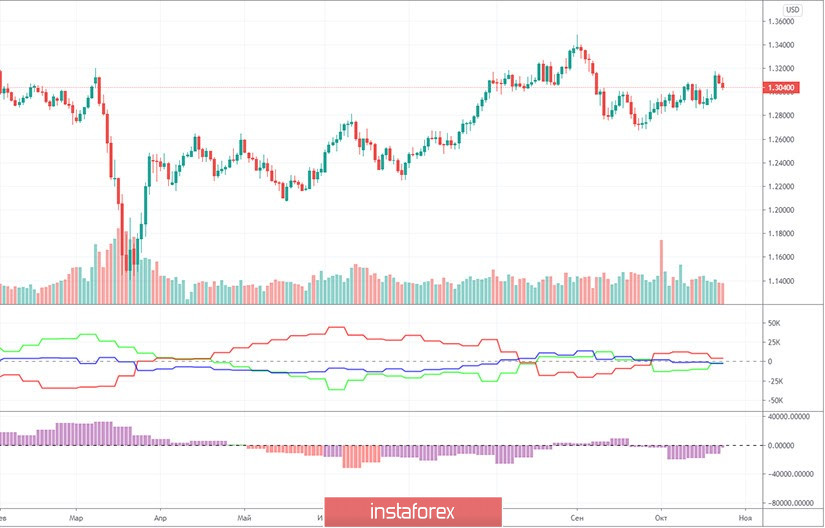
The new Commitments of Traders (COT) report for the pound showed that non-commercial traders were quite active during October 13 to 19. However, at the same time, the last few reports have completely made the situation complicated. The "non-commercial" group of traders opened 4,485 Buy-contracts (longs) and closed 4,072 Sell-contracts (shorts). Thus, the net position of professional traders immediately grew by 8,500 contracts, which is quite a lot for the pound. However, the problem is that non-commercial traders have been building up their net position (strengthening the bullish sentiment) over the past few weeks, and before that they have reduced their net position for several weeks (strengthening the bearish sentiment). Thus, over the past months, professional players have not even been able to decide in which direction to trade. The fundamental background continues to be very difficult and ambiguous for the pound/dollar pair, which is why the trades are so confusing. The pound sterling lost approximately 110 points during the reporting period. And the net positions of commercial and non-commercial traders are now practically zero. In other words, both the most important and largest groups of traders have approximately the same number of Buy and Sell contracts open. Naturally, such data from the COT report does not allow any conclusions, either short-term or long-term.
Fundamental background for GBP/USD remained unchanged on Thursday. Traders were forced to pay attention to US reports, since London did not provide any data. Either Michelle Barnier and David Frost decided to extend the next round of negotiations even further, or there is no progress and there is simply nothing to announce. However, US reports were enough to pull down the pound. We already warned you that the GDP report is an important report, and if the forecast value is exceeded, then the reaction is almost inevitable. And so it happened. The forecast was exceeded by 2.1% and this report was enough for the pound to tumble by100 points. But if we receive information about the lack of progress in negotiations between London and Brussels, this could cause the pound to fall by another 100 points. Minor reports will be released in the United States on Friday, such as changes in the level of income and expenses or consumer confidence index. Not a single publication planned for the UK, therefore, the reports on inflation and GDP in the European Union will cause the greatest interest among traders.
We have two trading ideas for October 30:
1) Buyers for the pound/dollar pair failed to gain a foothold above the Senkou Span B line. Therefore, the initiative remains in the hands of the bears, and long positions are irrelevant. You are advised to consider long deals in case the price settles above the Senkou Span B (1.3018) and Kijun-sen (1.3002) lines while aiming for the resistance area of 1.3160 -1.3184. Take Profit in this case will be up to 110 points. However, this is unlikely to happen today.
2) Sellers continue to pull down the pair and so they reached 1.2897, now a correction may take place for some time. If the correction is strong, that is, to the Kijun-sen line, then you are advised to resume trading down in case the price rebounds from this line, and you can aim for 1.2897 and the support area of 1.2854-1.2874. Otherwise, we recommend waiting for the price to settle below the 1.2854-1.2874 area and trade while aiming for the 1.2754 level. Take Profit in the first case will be 90-110 points, in the second - up to 80.
Hot forecast and trading signals for EUR/USD
Explanations for illustrations:
Support and Resistance Levels are the levels that serve as targets when buying or selling the pair. You can place Take Profit near these levels.
Kijun-sen and Senkou Span B lines are lines of the Ichimoku indicator transferred to the hourly timeframe from the 4-hour one.
Support and resistance areas are areas from which the price has repeatedly rebounded off.
Yellow lines are trend lines, trend channels and any other technical patterns.
Indicator 1 on the COT charts is the size of the net position of each category of traders.
Indicator 2 on the COT charts is the size of the net position for the "non-commercial" group.
InstaForex analytical reviews will make you fully aware of market trends! Being an InstaForex client, you are provided with a large number of free services for efficient trading.

