 Stay
Stay 
Trading Conditions
Products
Tools


Yesterday, the pair moved up and tested the resistance line at 1.3383 (black bold line) and then went down, closing the day at 1.3320. Today, the upward movement may continue. News on the market is expected at 12:30 UTC (Pound) and 18:00 UTC (Dollar).
Trend analysis (Fig. 1)
Today, the market will try to continue moving up from the level of 1.3320 (the closing of yesterday's daily candle) with the goal of 1.3381 which is the resistance line (black bold line). If this level is reached, continue working up with the target 1.3436 upper fractal (red dotted line) which was the daily candle from 01/09/2020.
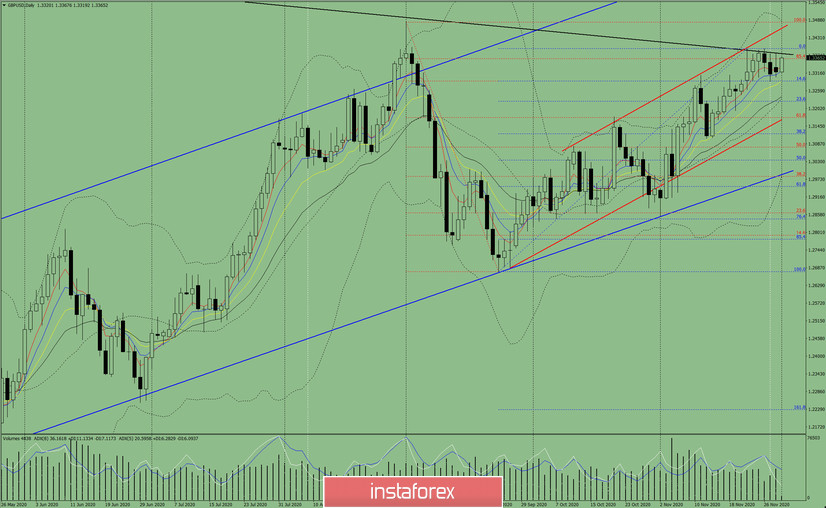
Figure 1 (daily chart)
Complex analysis:
General conclusion:
Today, from the level of 1.3320 (the closing of yesterday's daily candle), the price will try to continue moving up with the target of 1.3381 which is the resistance line (black bold line). If this level is reached, continue working up with the target of 1.3436 of the upper fractal (red dotted line) which was the daily candle from 01/09/2020.
Alternative scenario: There will be upward movement with the target of 1.3381 which is the resistance line (black bold line). If this level is reached, there will be a pullback down with the target of 1.3290. The pullback level is 14.6% (red dotted line).
InstaForex analytical reviews will make you fully aware of market trends! Being an InstaForex client, you are provided with a large number of free services for efficient trading.


