 Stay
Stay 
Trading Conditions
Products
Tools


Trend analysis.
In December, the upward movement is likely to continue with the first target of 1.2101 - the pullback level of 76.4% (blue dotted line). If this level is broken upward, the next upper target will be 1.2273 - the pullback level of 85.4% (blue dotted line).
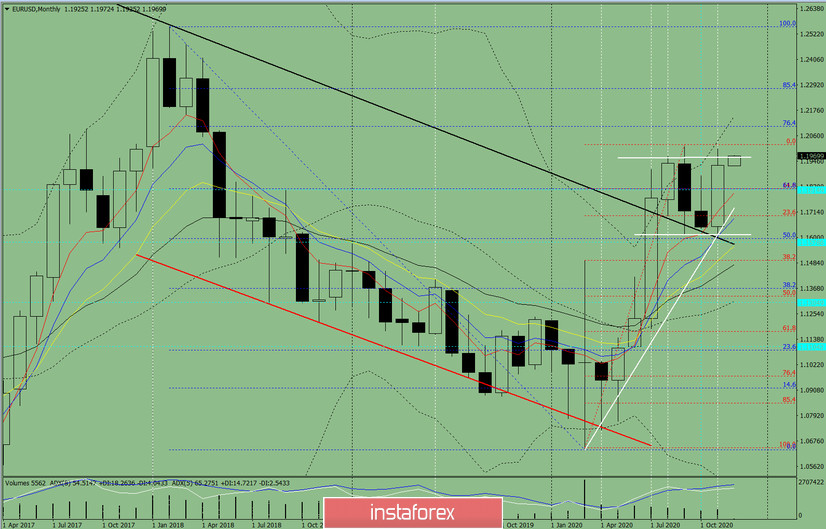
Figure 1 (Monthly Chart).
Indicator analysis:
Conclusion on the complex analysis is most likely the top job.
The general result of the candlestick calculation of the EUR/USD currency pair on the monthly chart: the price is most likely to have an upward trend with the absence of the first lower shadow (the first week of the month is the upper one) in the monthly white candlestick and the absence of the second upper shadow (the last week is white).
General scenario: from the level of 1.1926 (closing of the November monthly candlestick), there will be an upward movement with the target of 1.2101, which is a pullback level of 76.4% (blue dotted line). If this level is broken upward, the next upper target will be 1.2273 - the pullback level of 85.4% (blue dotted line).
Unlikely scenario: from the level of 1.1926 (closing of the November monthly candlestick), there will be an upward movement with the target of 1.1960, which is the resistance level (white bold line). If this level is tested, the pair will move downward with the lower target of 1.1821 – the pullback level of 14.6% (red dotted line).
InstaForex analytical reviews will make you fully aware of market trends! Being an InstaForex client, you are provided with a large number of free services for efficient trading.

