 Stay
Stay 
Trading Conditions
Products
Tools


GBP/USD 5M
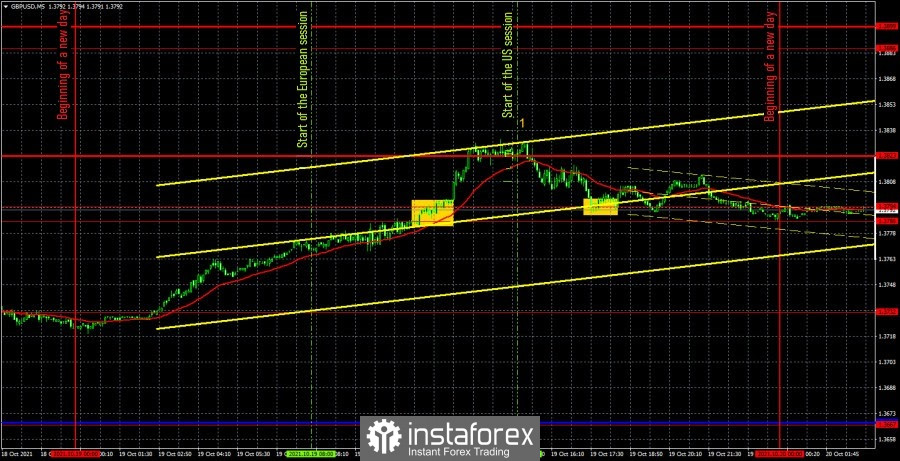
The GBP/USD pair was also trading quite actively on October 19, but at the same time most of the trend, upward movement, also happened at night, when the majority of the traders were sleeping. Thus, if we calculate the volatility only during the daytime, it turns out that the pound/dollar pair went from a minimum to a maximum of only 64 points, which is very little. A little, but still could allow traders to make money. However, first of all, it should be noted that yesterday, only one fundamental event could theoretically have an impact on the movement of the pound/dollar pair. This is the speech of the Governor of the Bank of England Andrew Bailey, which began exactly at the opening of the US trading session (the number "1" in the chart). As you can see, it was at this time that the pound stopped rising, but it is not completely clear what exactly caused it to end: the beginning of the US session or Bailey's speech? Note that the growth of the European currency also ended at about the same time. Anyway, after the pair turned around the resistance level of 1.3823, all long positions should have been closed. And they should have been opened by a buy signal, which was formed in the middle of the European trading session, when the price crossed the 1.3785-1.3794 area. This signal could have earned 23 points. Theoretically, the second buy signal could also be worked out, but it was already, as they say, borderline, as it was formed in the late afternoon. Nevertheless, if traders nevertheless decided to work it out too, they could earn another 5-10 points of profit.
GBP/USD 1H
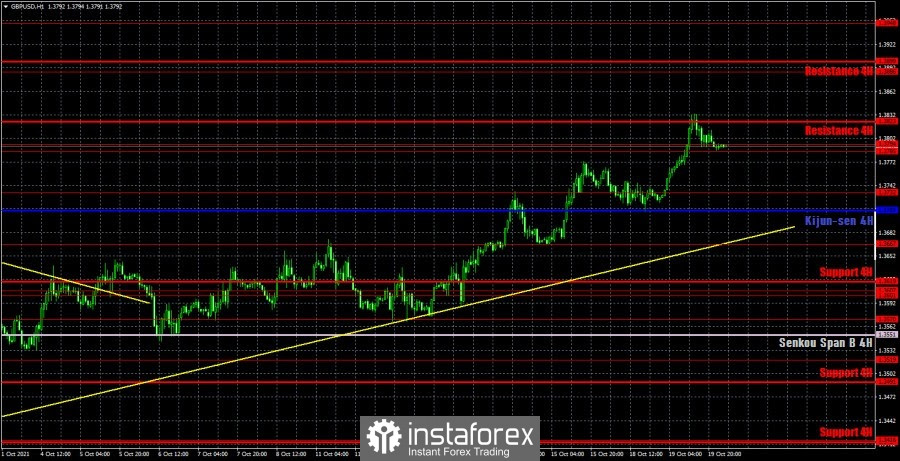
The pound/dollar pair maintains an upward trend on the hourly timeframe, as it continues to be located above the uptrend line. The price, as you can see in the chart, reached the critical line yesterday, but in reality it is an illusion: on the 4-hour timeframe, from where the Kijun-sen line was transferred here, it is clear that there was no rebound. Thus, the bulls simply continued to buy the British currency, which kept the current upward trend. Until the price settles below the trend line, it is not recommended to consider the downward movement and sell. We distinguish the following important levels on October 20: 1.3667, 1.3732, 1.3785 - 1.3794, 1.3886. Senkou Span B (1.3551) and Kijun-sen (1.3709) lines can also be sources of signals. It is recommended to set the Stop Loss level at breakeven when the price passes 20 points in the right direction. The Ichimoku indicator lines can move during the day, which should be taken into account when looking for trading signals. The UK will publish its September inflation report on Wednesday. Considering Bailey's latest statements, the CPI may continue to accelerate to 4% or more. At the moment, it is 3.2% y/y and, judging by the forecasts of analysts, will not change in September. Nothing interesting planned in the US for today. The Federal Reserve Review "Beige Book" is a purely informative booklet that almost never evokes any reaction from the market.
We recommend you to familiarize yourself:
Overview of the EUR/USD pair. October 20. Janet Yellen: Our song is good, start over.
Overview of the GBP/USD pair. October 20. The US dollar is falling on all fronts. The UK is preparing to raise the key rate.
Forecast and trading signals for EUR/USD for October 20. Detailed analysis of the movement of the pair and trade deals.
COT report
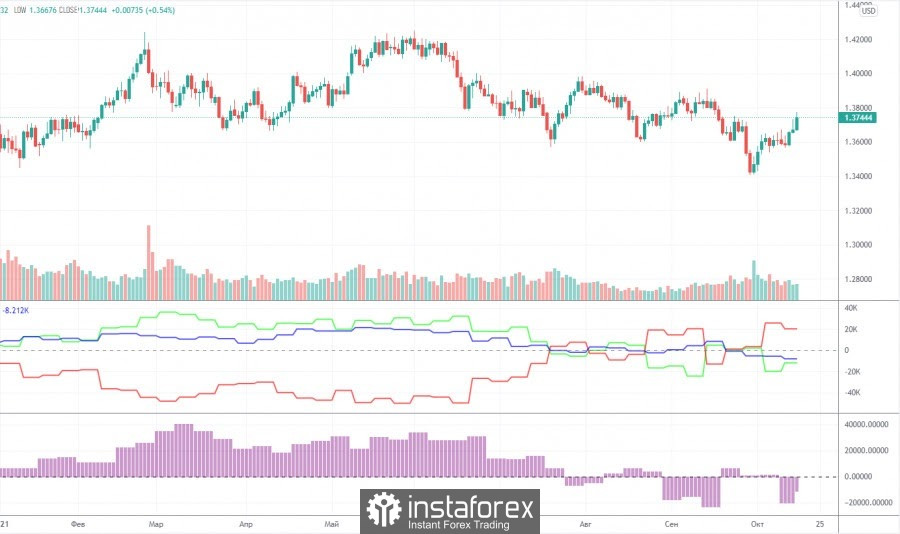
The mood of professional traders became less bearish again during the last reporting week (October 5-11). Major players closed 1,700 buy contracts (longs) and 10,600 sell contracts (shorts) during the week. Thus, the net position of professional traders has grown by almost 9,000, which is quite a lot for the pound. In principle, such a change in the mood of major players correlates well with how the pair moved during the same time period. The pound was growing, so it's reasonable to assume that the big players were buying it, not selling it. However, we are most interested in the general trend in COT reports. That is, how non-commercial traders behave over a long distance. And now let's look at the first indicator, especially at its movements over the past three months. The green and red lines (net positions of non-commercial and commercial traders) constantly change the direction of movement, cross each other, cross the zero mark. This suggests that there is no clear mood among the major players right now. It is constantly changing, which means there is no trend now. Moreover, if you look at the movements of the pair itself over the past 6-7 months, it is also clearly visible that the minimum downward trend is, of course, present, but still the quotes spent most of the time between the 36th level and the 42nd. That is, inside the horizontal channel. Thus, from our point of view, the Commitment of Traders (COT) reports now do not provide an opportunity to predict the pair's succeeding movement.
Explanations for the chart:
Support and Resistance Levels are the levels that serve as targets when buying or selling the pair. You can place Take Profit near these levels.
Kijun-sen and Senkou Span B lines are lines of the Ichimoku indicator transferred to the hourly timeframe from the 4-hour one.
Support and resistance areas are areas from which the price has repeatedly rebounded off.
Yellow lines are trend lines, trend channels and any other technical patterns.
Indicator 1 on the COT charts is the size of the net position of each category of traders.
Indicator 2 on the COT charts is the size of the net position for the non-commercial group.
InstaForex analytical reviews will make you fully aware of market trends! Being an InstaForex client, you are provided with a large number of free services for efficient trading.

