 Stay
Stay 
Trading Conditions
Products
Tools


Trend analysis (Fig. 1).
On Monday, the price is likely to rise to the upper fractal located at 1.1669 (the red dotted line) from the close of Friday's daily candlestick at 1.1644. After the publication of an important report, a pullback may occur. Overall, the upward trend is expected to extend today. If the pair test the level of 1.1669, the next target will be seen at the historic resistance level of 1.1705 (the blue dotted line).
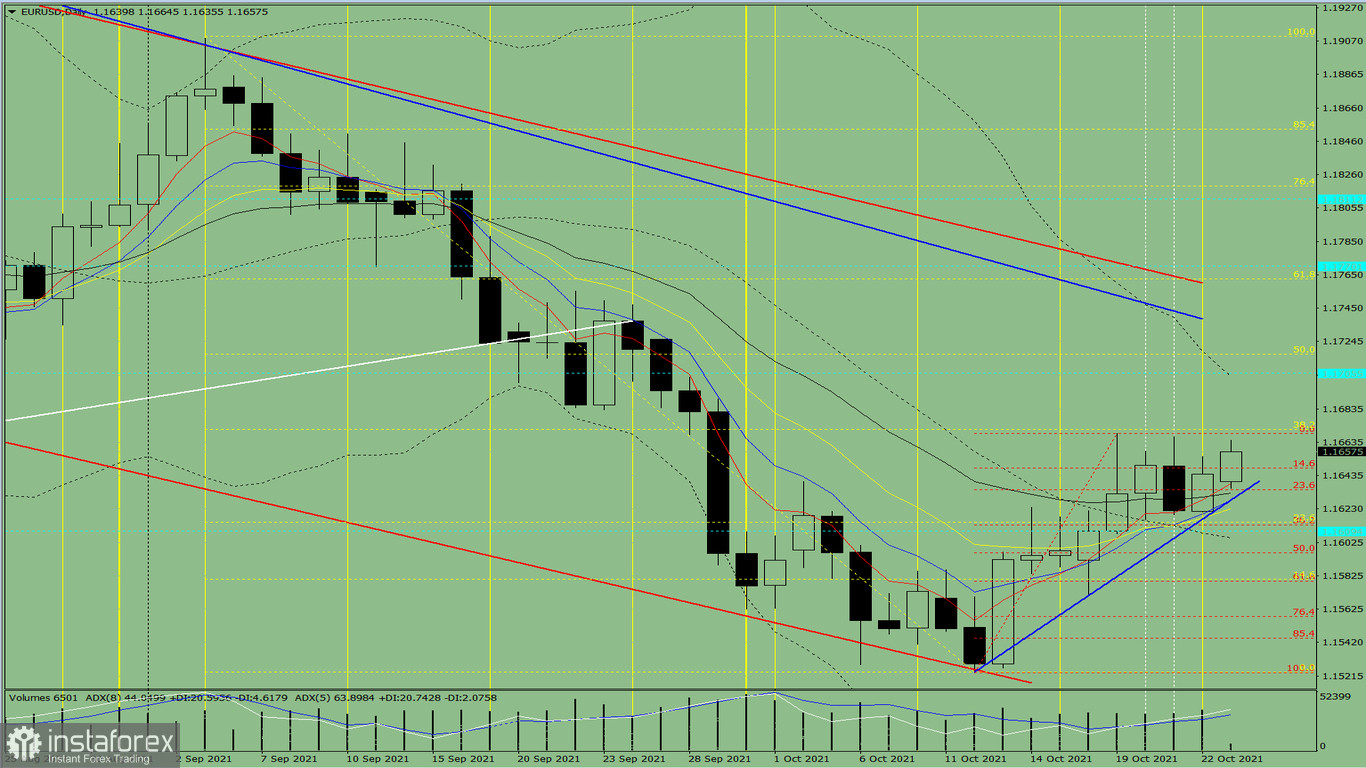
Fig. 1 (daily chart)
Comprehensive analysis:
- indicator analysis - upward trend
- Fibonacci levels analysis - upward trend
- volume analysis - upward trend
- candlestick analysis - upward trend
- trend analysis - upward trend
- Bollinger bands analysis - upward trend
- weekly chart analysis - upward trend
Conclusion:
Today, from the close of Friday's daily candlestick at 1.1644, the quote is likely to rise to the upper fractal located at 1.1669 (the red dotted line). If the pair test this level, the next target will be seen at the historic resistance level of 1.1705 (the blue dotted line). In case the price approaches this mark, the upward trend will extend.
Alternatively, from the close of Friday's daily candlestick at 1.1644, the quote may rise to the upper fractal of 1.1669 (the red dotted line). When testing this level, the quote may go down to the 23.6% retracement level of 1.1635 (the red dotted line). After reaching this line, the continuation of the upward trend is expected.
InstaForex analytical reviews will make you fully aware of market trends! Being an InstaForex client, you are provided with a large number of free services for efficient trading.

