 Stay
Stay 
Trading Conditions
Products
Tools


EUR/USD 5M
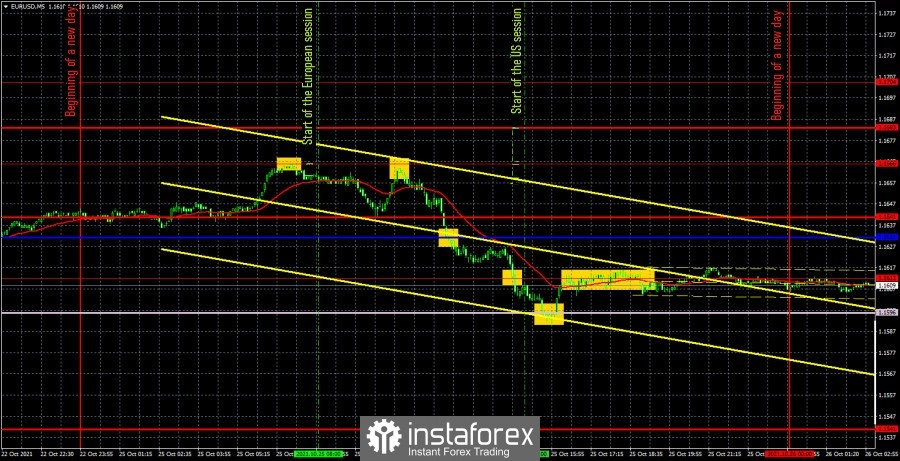
During the first trading day of the week, the EUR/USD pair finally showed the movement that has been expected from it for a long time. Unfortunately, such days are rare in recent months. Thus, yesterday can be considered an exception to the rule. Moreover, there were no macroeconomic statistics or important fundamental events on Monday in either the European Union or the United States. Therefore, what caused the movement by 75 points, when the usual volatility has recently been 40, it is rather difficult to say. Nevertheless, traders could only rejoice that at least sometimes the pair still shows signs of life. Let's start analyzing technical signals. The first sell signal was formed even before the beginning of the European trading session, so traders missed it. However, the price returned to the extremum level of 1.1666 at the beginning of the European session and, having not reached two points, started moving down again. Here, traders could open a short position even at the opening of the European session, because by that time the price had gone close to the level of 1.1666. Those who did not have time could sell during the second approach to the level of 1.1666. One way or another, but a short position had to be opened and it was it that brought a solid profit. The price subsequently crossed the level of 1.1641, the Kijun-sen line, the extremum level of 1.1612 and stopped only near the Senkou Span B line, from which it rebounded. Thus, it was on this rebound that a short position should have been closed at a profit of 56 points. Pay attention to how strong all the signals of the day were. One should also open a deal on a rebound from the Senkou Span B line, but for a long position. However, the markets did not have enough strength for the second powerful movement, so everything ended around the level of 1.1612, where it was necessary to close long positions in profit for another couple of points. Thus, Monday has become a very good day for traders.
EUR/USD 1H
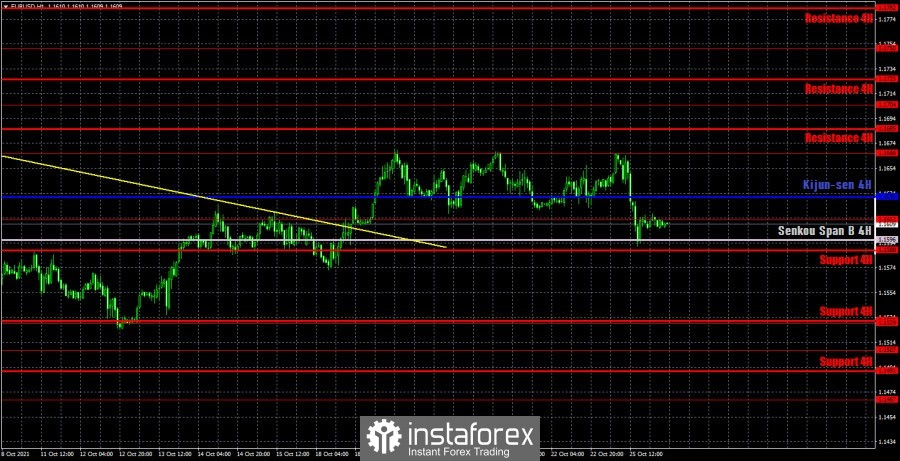
The hourly timeframe also shows how strong the movement was on Monday. Nevertheless, it still looks like a sideways movement on a longer timeframe. A rather imprecise horizontal channel, but the price moves mostly sideways. There is no trend line at this time, and a rebound from the Senkou Span B line may provoke a resumption of the upward movement, which seems to have begun after overcoming the previous downtrend line. We highlight the following levels for trading on Tuesday - 1.1529, 1.1612, 1.1666, as well as the Senkou Span B (1.1596) and Kijun-sen (1.1630) lines. The Ichimoku indicator lines can change their position during the day, which should be taken into account when looking for trading signals. Signals can be rebounds or breakthroughs of these levels and lines. Do not forget about placing a Stop Loss order at breakeven if the price moves 15 points in the right direction. This will protect you against possible losses if the signal turns out to be false. Also, do not forget that the Ichimoku indicator lines lose their strength in a flat, so they can even be ignored, especially the Kijun-sen line. Or work out only when there are really strong signals. The calendars of macroeconomic events in the European Union and the United States are practically empty on October 26. The consumer confidence report for October will be published in America. But what is the likelihood that there will be at least some market reaction to it if much more important events were ignored on Friday?
We recommend you to familiarize yourself:
Overview of the EUR/USD pair. October 26. Traders are beginning to believe again in the collapse of QE in November.
Overview of the GBP/USD pair. October 26. Janet Yellen: we control inflation.
Forecast and trading signals for GBP/USD for October 26. Detailed analysis of the movement of the pair and trade deals.
Analysis of the COT report
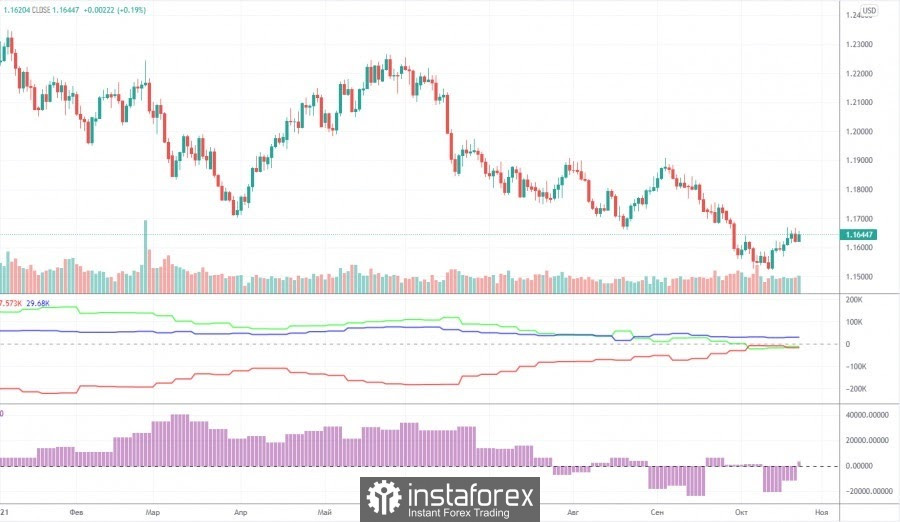
The mood of non-commercial traders changed into a bullish direction during the last reporting week (October 12-18). During the reporting week, 8,500 buy contracts (longs) and 16,000 sales contracts (shorts) were closed. Thus, the net position of the "non-commercial traders" group, which is the most important group, increased by 7.5 thousand. And here it is just right to talk about the "disease of the British pound." Let us remind you that the net position of professional pound players has been jumping up and down over the past few months. And this, in turn, indicates that there is no single mood and clear trend. We are seeing the same thing now in the euro currency. This is eloquently signaled by the second indicator, which shows either an increase in the net position or a decrease. Consequently, at this time, major players do not understand what to do next with the euro currency. Also, in the chart above, you can see that the pair rate went only 100 points below the previous local low. Therefore, at this time, the entire technical picture of the long-term plan still looks like a standard three-wave correction. Therefore, from our point of view, the formation of a new upward trend in the near future is still very likely, given the attempts with which the European currency has been falling over the past 8-9 months. But at the same time, we remind you that while there are no buy signals, you should not rush to the market with long positions. Any fundamental hypothesis requires specific technical confirmation. If they are not there, then you should not make the appropriate trading decisions.
Explanations for the chart:
Support and Resistance Levels are the levels that serve as targets when buying or selling the pair. You can place Take Profit near these levels.
Kijun-sen and Senkou Span B lines are lines of the Ichimoku indicator transferred to the hourly timeframe from the 4-hour one.
Support and resistance areas are areas from which the price has repeatedly rebounded off.
Yellow lines are trend lines, trend channels and any other technical patterns.
Indicator 1 on the COT charts is the size of the net position of each category of traders.
Indicator 2 on the COT charts is the size of the net position for the non-commercial group.
InstaForex analytical reviews will make you fully aware of market trends! Being an InstaForex client, you are provided with a large number of free services for efficient trading.

