 Stay
Stay 
Trading Conditions
Products
Tools


Trend analysis (fig. 1).
On Tuesday, the market will try to continue upward movement from 1.3762 (yesterday's daily candlestick close) with the target at 1.3833, the upper fractal (blue dotted line). If this level is tested, upward movement with the target at 1.3899, the upper limit of the Bollinger line indicator (black dotted line) is observed.
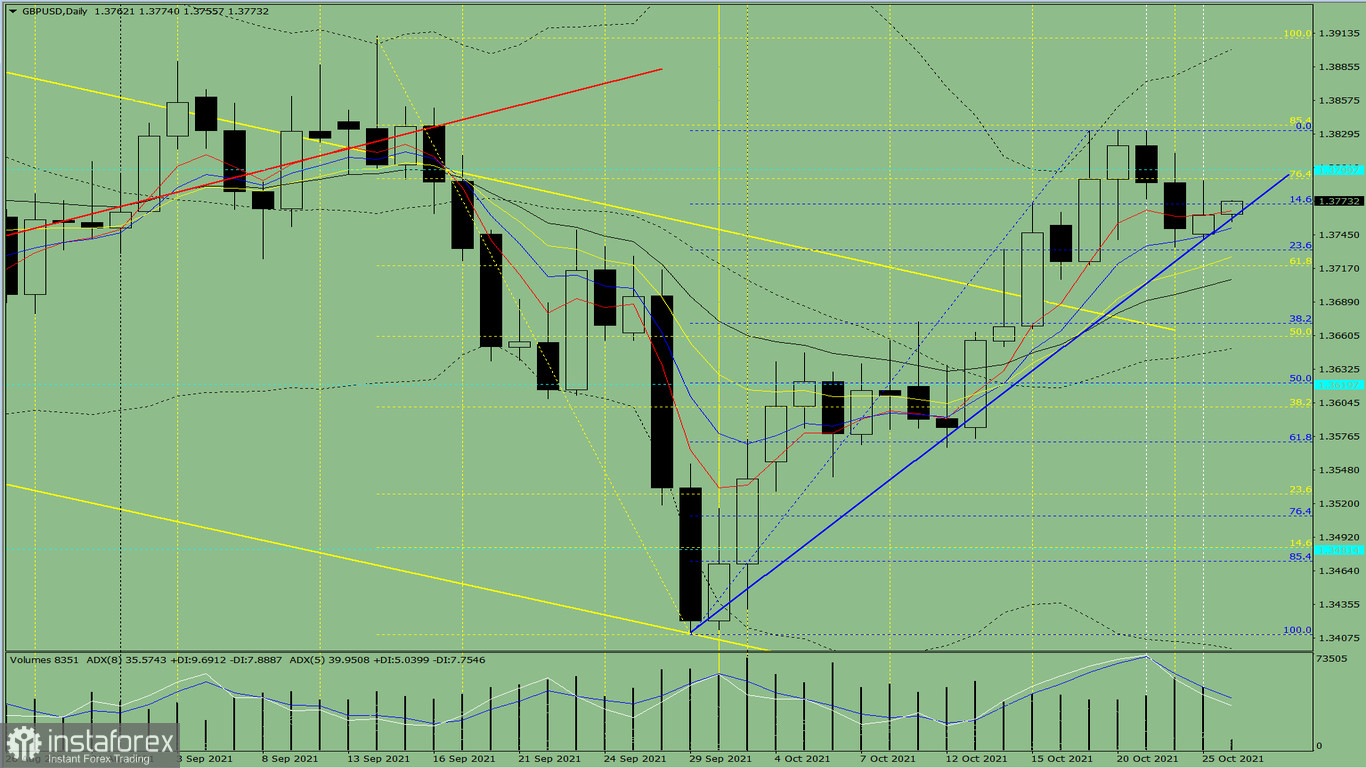
Fig. 1 (daily chart).
Complex analysis:
- indicator analysis - uptrend;
- Fibonacci levels - uptrend;
- volumes - uptrend;
- candlestick analysis - uptrend;
- trend analysis - uptrend;
- Bollinger bands - uptrend;
- weekly chart - uptrend.
General conclusion:
Today, the price will try to continue upward movement from 1.3762 (yesterday's daily candlestick closing) with the target at 1.3833, the upper fractal (blue dotted line). If this level is tested, upward movement with the target at 1.3899, the upper limit of the Bollinger line indicator (the black dotted line) is observed.
Unlikely scenario: the price will try to continue downward movement from 1.3762 (yesterday's daily candle closing), with the target at 1.3732, the 23.6% retracement level (blue dotted line). If this level is tested, further upward movement with the target at 1.3792, the 76.4% retracement level (yellow dotted line) is observed.
InstaForex analytical reviews will make you fully aware of market trends! Being an InstaForex client, you are provided with a large number of free services for efficient trading.

