 Stay
Stay 
Trading Conditions
Products
Tools


After a robust start to the trading week and hitting an all-time high, bitcoin rebounded strongly and fell by 9%. As a result, the asset managed to partially recover, but yesterday's confusion due to the inflation report and the subsequent drop destabilized the cryptocurrency. However, more concerns are raised by the technical analysis of the asset, where a bearish pattern has formed, indicating a further decline in the price. In order to determine the price range of BTC, it is necessary to conduct a technical analysis and identify the area within which the trade will take place.
First of all, we have to identify the reasons for such sharp fluctuations in the asset's trading. Data on high inflation in the US triggered market participants to buy bitcoin, thanks to which the asset reached a new all-time high at $69,000. However, rumors that the Chinese real estate developer Evergrande went bankrupt caused turbulence in the financial markets and was reflected in bitcoin quotations. As a result, bitcoin hit a new high in a short period of time and dropped by 9%, making investors seriously concerned. One should not expect a quick recovery of growth, as the digital asset needs to stabilize.
The relative strength index (RSI) is a technical indicator that allows you to determine the strength of the trend (downward or upward) and alerts you to possible changes in the price trend. Using this indicator we can determine whether an asset is overbought or underbought. The optimal level for this chart is 60 if we are talking about a bullish trend. It indicates a high demand for bitcoin and the strength of the current upward momentum. When the asset breaks through this mark, it starts moving into an overbought area.
MACD (Moving Average Convergence/Divergence Index) is an indicator which allows drawing certain conclusions about the trend based on the movement of moving averages and finding metric values between them. A bullish signal is when the white line breaks through the red line from below and a bearish signal, on the contrary, is when the white line breaks through the red line from above, indicating a downward movement.
The stochastic (stochastic oscillator) is an indicator that shows the strength of the momentum of the current prevailing trend. If the indicator is above 80, the asset can be considered overbought, but if the stochastic is below 20, it is a signal that the asset is oversold.
The supertrend indicator reflects a bullish (green - signal to buy) and bearish (red - signal to sell) trend on the horizontal charts of the cryptocurrency.
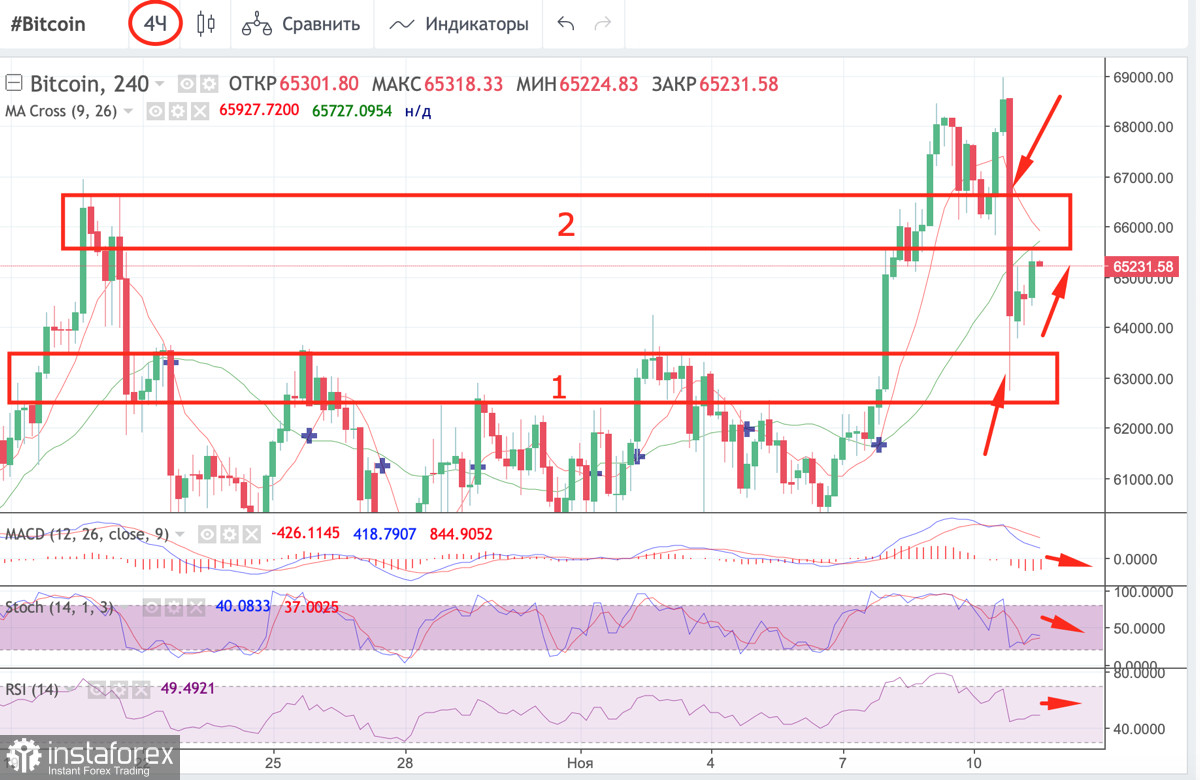
The 4-hour chart shows a decline continuing to $62,700, where support is located, thanks to which the price was able to rebound to $64,200. The long lower wick of the highlighted candlestick proves this, indicating a bullish pressure. Notably, the rebound was weak and the price stuck between $64,400 and $65,500, showing the weakness of the support level. Bitcoin made a shaky bullish breakout of the first resistance area. As of 12:00 p.m., BTC quotes were locked between the first and the second areas, as seen by the upper wicks of the green candlesticks. Bitcoin needs to move out of this range to recover the short-term uptrend. According to the technical indicators, the price may continue to stabilize in a narrow range. The indicators are reducing their rates of decline, but still point to the weakness of the buyers and the lack of strength for an upward rush. The MACD is moving toward the zero area, indicating a lack of strength for short-term momentum, while the stochastic and the relative strength index are close to declining beyond 40, indicating a weak bullish sentiment. The four-hour timeframe shows preconditions for a sideways movement with a parallel decline to the lower boundary of the trading range.
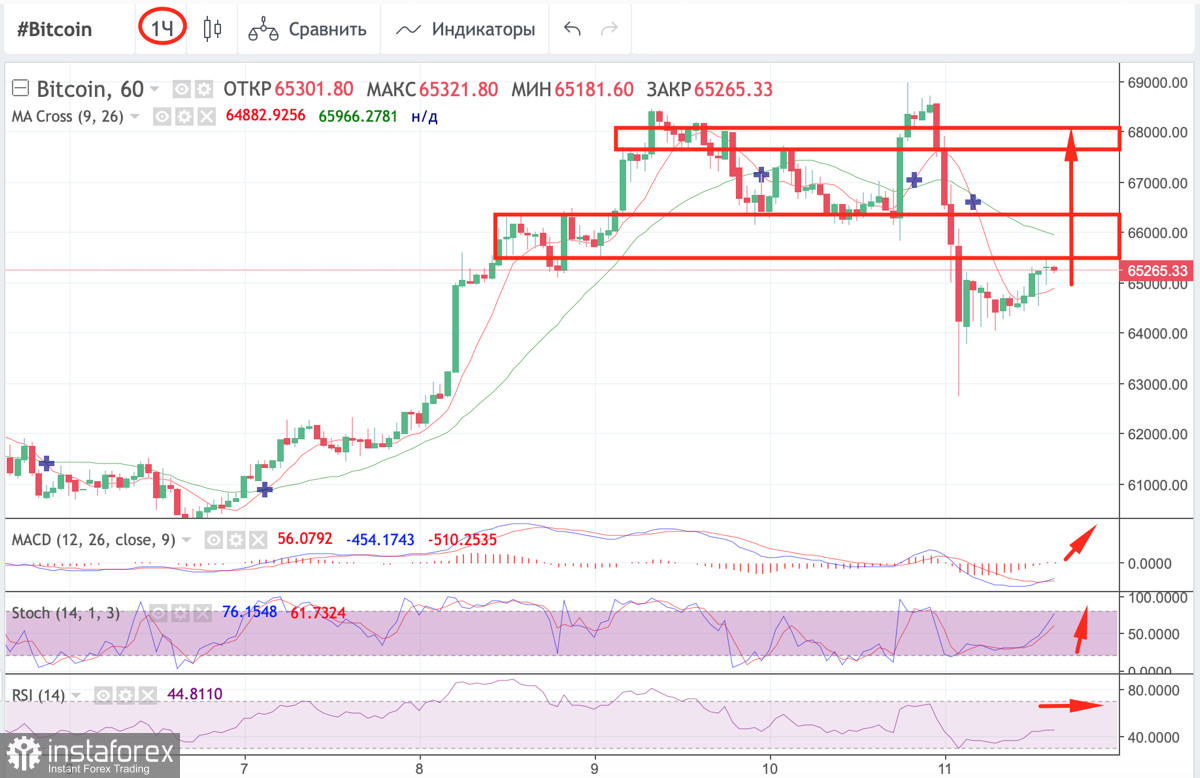
On the hourly chart bitcoin looks more confident and signals an attempt to launch a local uptrend. After an unsteady period of recovery, technical indicators began to show prerequisites for the bulls to increase their strength. MACD forms a bullish cross, which is a signal to increase the activity of buyers and the desire of the market participants to break through support at $65,800. Meanwhile, the stochastic oscillator maintains a strong upward trend, which forms a divergence with the downward price movement. The relative strength index is moving sideways, but it is gradually starting to decline, which indicates that there are no strong players to implement bullish momentum. Another downside signal is a doji candlestick, which indicates that the bulls and the bears are equal in strength. Taking into account the price movement and the divergence, we conclude that the initiative is in the hands of the sellers. Therefore, the signal of a stabilization period on the 4-hour timeframe remains.
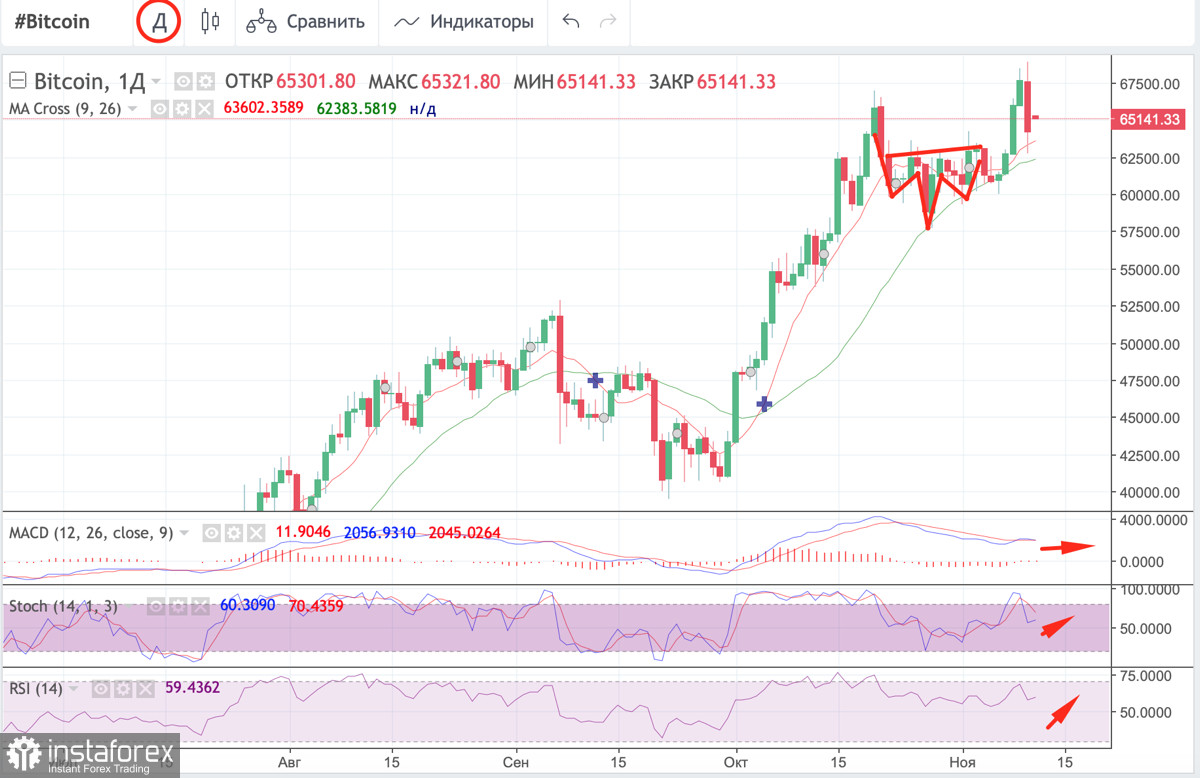
Technical indicators of the daily chart show that the situation stabilizes and the upward trend continues: MACD has started to move sideways, while the stochastic oscillator and the relative strength index began to show the emergence of an upward trend. However, the head and shoulders pattern has formed on the charts, indicating a trend reversal. We should expect a correction towards support levels, before the start of a new price hike. BTC is likely to bounce from support at $64,400, but if it breaks through this level, it may drop below $60,000, where there are two key buy areas at $58,500 and $53,600. If the price breaks through $64,400, there is an opportunity to go short just below the support with a stop loss at $64,480. However, it is better to keep an eye on the price trend and not to stop the candlestick analysis on different timeframes.
InstaForex analytical reviews will make you fully aware of market trends! Being an InstaForex client, you are provided with a large number of free services for efficient trading.


