 Stay
Stay 
Trading Conditions
Products
Tools


Analysis of previous deals:
30M chart of the GBP/USD pair
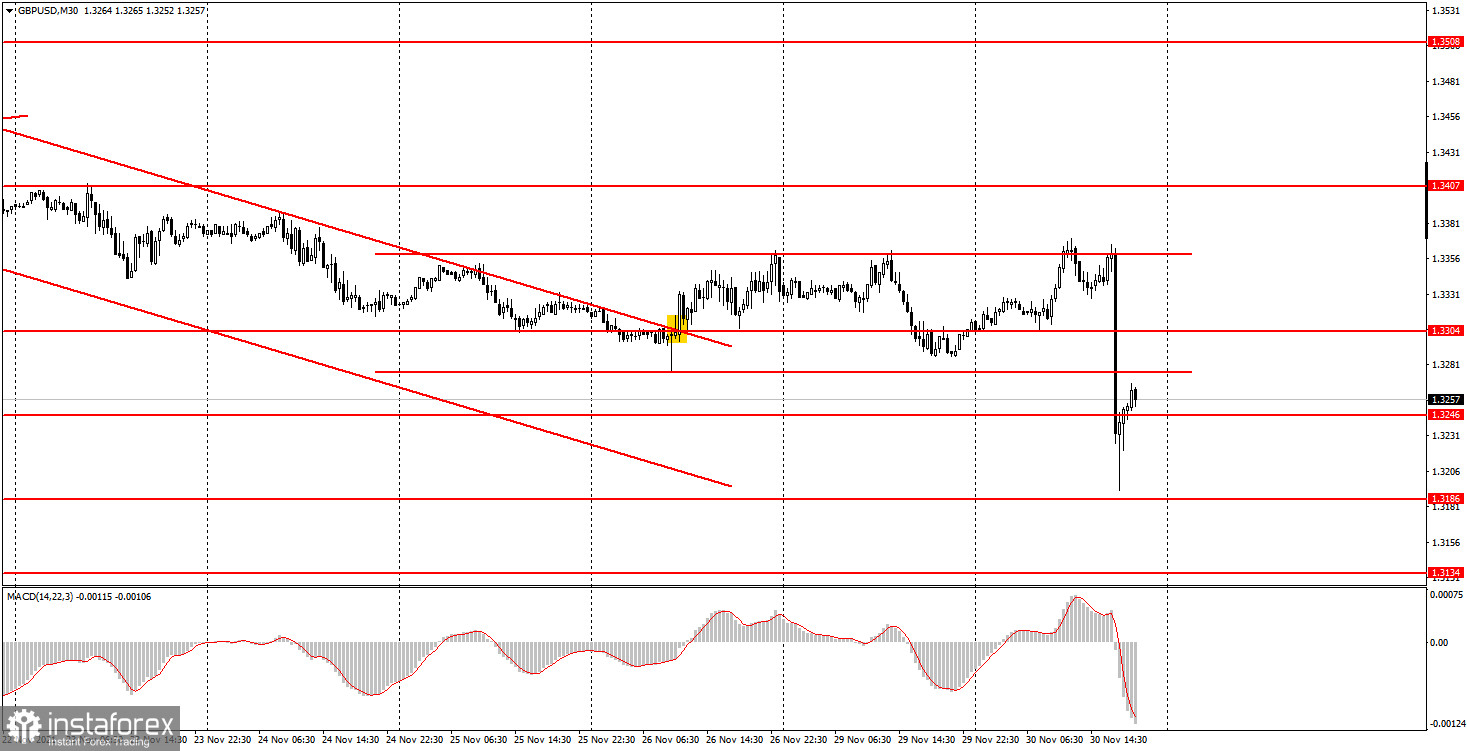
The GBP/USD pair was trading quite predictably before the collapse in the second half of today. The pair's quotes returned to the upper border of the horizontal channel and bounced off it two more times. Therefore, novice traders could already open short positions at these moments, as we advised yesterday. However, in general, it should be noted that the pound failed to continue the upward movement, which once again showed the lack of desire on the markets to trade the pair for an increase. Although after the collapse by 170 points, we would on the contrary assume that today the pair will return to the level of 1.3359. Everything looks too much like a banal disruption of the bulls' Stop Loss orders. At a time when the pair seems to have completed the downward trend and was already "aiming" for a new upward trend, such a collapse occurs. At the same time, it is not even possible to say for sure why it happened. Formally, the timing of Powell and Yellen's speech in the Senate coincided with the fall, but this was their second speech in the Senate in two days. Just in front of different committees. Usually the text of the speeches is the same, except that Powell or Yellen were asked some uncomfortable question, the answer to which shocked the market...
5M chart of the GBP/USD pair
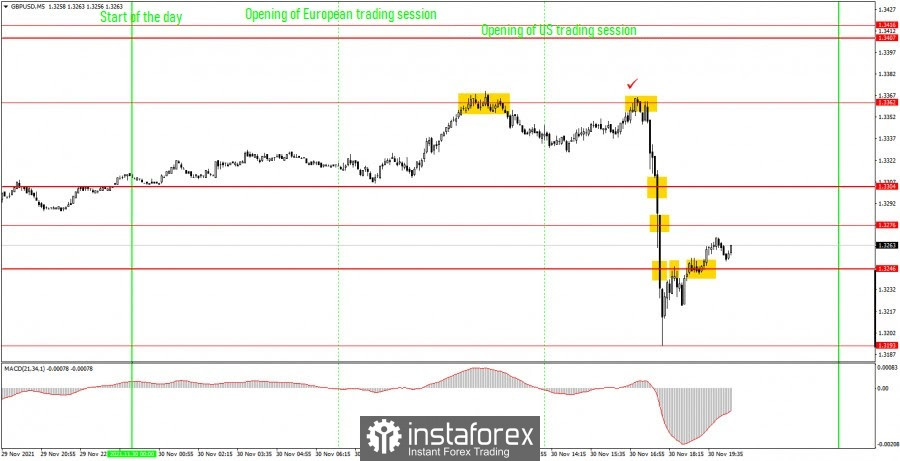
On the 5-minute timeframe, the movement of the pound/dollar pair on Tuesday was quite interesting. There were much fewer trading signals during the day than for the euro/dollar pair, which is even good. In principle, we can only talk about two sell signals that have formed around the level of 1.3362. This level is the previous day's high - Monday. And also Friday's. As you can see, two excellent signals were formed around it, which should have been worked out. But not everything is so simple. After the first signal, the pair went down more than 20 points, so a Stop Loss order should have been placed at breakeven. According to this order, the short position was closed, as the quotes returned to the level of 1.3362 in the US session. They returned to bounce back again, which coincided with the speeches of Jerome Powell and Janet Yellen. However, the fall did not instantly start, so novice traders could have time to open new short positions on this signal. Subsequently, the pair overcame the levels of 1.3304, 1.3276, 1.3246. And when the price settled back above 1.3246, it was possible to close this deal. It could also close on any Take Profit, so the profit was received in any case.
How to trade on Wednesday:
At this time, on the 30-minute timeframe, the downward trend was canceled in just a couple of days and a horizontal channel was formed. And in a couple of days, the horizontal channel was canceled and a new downward trend was formed, judging by the nature of which, it will also be short-lived. The important levels on the 5-minute timeframe are 1,3193, 1,3246, 1,3276, 1,3304, 1,3362, 1,3407 – 1,3416. We recommend trading them on Wednesday. The price can rebound from them or overcome them. There are no important levels below, as the price has not been at these price points for more than a year. As before, we set Take Profit at a distance of 40-50 points. On the 5M TF, you can use all the nearest levels as targets, but then you need to take the profit, taking into account the strength of the movement. When passing 20 points in the right direction, we recommend setting the Stop Loss to breakeven. On December 1, the business activity index for the manufacturing sector will be published in the UK and Andrew Bailey will speak, which may be interesting. In America, we highlight the ADP report and the ISM Manufacturing Business Activity Index. As you can see, tomorrow there will also be interesting statistics and a foundation.
Basic rules of the trading system:
1) The signal strength is calculated by the time it took to form the signal (bounce or overcome the level). The less time it took, the stronger the signal.
2) If two or more deals were opened near a certain level based on false signals (which did not trigger Take Profit or the nearest target level), then all subsequent signals from this level should be ignored.
3) In a flat, any pair can form a lot of false signals or not form them at all. But in any case, at the first signs of a flat, it is better to stop trading.
4) Trade deals are opened in the time period between the beginning of the European session and until the middle of the US one, when all deals must be closed manually.
5) On the 30-minute TF, using signals from the MACD indicator, you can trade only if there is good volatility and a trend, which is confirmed by a trend line or a trend channel.
6) If two levels are located too close to each other (from 5 to 15 points), then they should be considered as an area of support or resistance.
On the chart:
Support and Resistance Levels are the Levels that serve as targets when buying or selling the pair. You can place Take Profit near these levels.
Red lines are the channels or trend lines that display the current trend and show in which direction it is better to trade now.
The MACD indicator consists of a histogram and a signal line. When they cross, this is a signal to enter the market. It is recommended to use this indicator in combination with trend lines (channels and trend lines).
Important speeches and reports (always contained in the news calendar) can greatly influence the movement of a currency pair. Therefore, during their exit, it is recommended to trade as carefully as possible or exit the market in order to avoid a sharp price reversal against the previous movement.
Beginners on Forex should remember that not every single trade has to be profitable. The development of a clear strategy and money management are the key to success in trading over a long period of time.
InstaForex analytical reviews will make you fully aware of market trends! Being an InstaForex client, you are provided with a large number of free services for efficient trading.

