 Stay
Stay 
Trading Conditions
Products
Tools


Analysis of previous deals:
30M chart of the EUR/USD pair

The EUR/USD pair was in a state of "drunkenness" on Wednesday after a crazy Tuesday. Let us remind novice traders that on Tuesday evening, Federal Reserve Chairman Jerome Powell spoke in the Senate, who said that inflation in the United States, which is growing almost every month, can no longer be treated as a temporary phenomenon. Do recall that earlier Powell repeatedly insisted that high inflation is temporary and it will begin to decline. But this did not happen, and when Powell was directly asked in the Senate how much longer he would deny the problem of growing inflation, the US dollar jumped (the euro/dollar pair - down). The mechanism is quite simple here. The higher inflation in the US, the more likely it is that the Fed will take measures to contain it in the near future. And these measures can only be hawkish, that is, to tighten monetary policy. Therefore, we should expect a higher rate of curtailment of the QE program or a rate hike not in mid-2022, but earlier. It was these reflections that provoked the strong growth of the dollar. But, since these are just reflections, and not the actions of the Fed, the dollar very quickly lost its positions and returned to the opening levels of the day. Formally, the upward trend is still preserved, but the pair is not yet able to settle above the level of 1.1371.
5M chart of the EUR/USD pair
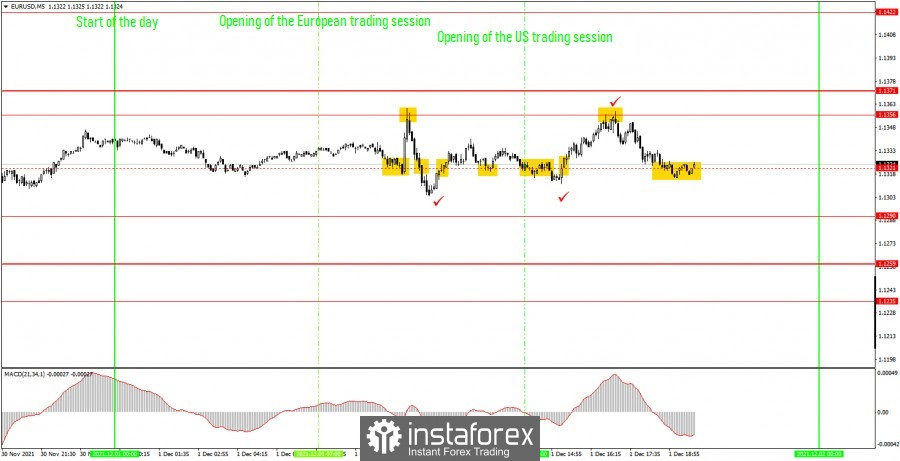
On a 5-minute timeframe, the picture on Wednesday was quite trivial and boring. When a flat starts, there are either no signals at all, or all of them are formed around the same level, and most of them are false. And so it was on Wednesday. The first buy signal was formed near the level of 1.1321, which was removed from the charts at the end of the day. Novice traders should have opened long positions, but did not get profit on them, since the first candle was very strong, and a rebound followed from the nearest level of 1.1356. On the other hand, following this sell signal, short positions should have been opened, and they brought a few points to the beginners' piggy bank, since the price dropped 50 points and settled even below the level of 1.1321. Thus, any Take Profit worked and brought 30-40 points of profit. Further, a buy signal was formed when the pair crossed the level of 1.1321 from the bottom up. It should have remained in the market until the start of the US session, when the ADP report was to be published. Before this report, positions should have been closed manually, as a reversal could have followed, and at that moment 4 false signals had already been generated near the level of 1.1321. All subsequent signals near the 1.1321 level should also be ignored. The last signal that should have been worked out was a rebound from the level of 1.1356, after which the price once again dropped to the level of 1.1321 and brought newcomers another 20 points.
How to trade on Thursday:
On the 30-minute timeframe, the downtrend has reversed, but the upward movement is not strong. Thus, the growth of the European currency may continue for some time, but the movement is unlikely to be strong. However, as long as the upward trend line remains relevant, buying remains more appropriate than selling. On the 5-minute timeframe, the key levels for December 2 are 1.1235, 1.1259, 1.1290, 1.1356, 1.1371. Take Profit, as before, is set at a distance of 30-40 points. Stop Loss - to breakeven when the price passes in the right direction by 15 points. At the 5M TF, the target can be the nearest level if it is not too close or too far away. If it is, then you should act according to the situation or work according to Take Profit. There won't be a single important event or publication in the European Union on Thursday. It will be possible to pay attention only to the report on applications for unemployment benefits in the United States and the speech of the Secretary of the Treasury Janet Yellen. But the probability of a reaction to these events is not more than 10%.
Basic rules of the trading system:
1) The signal strength is calculated by the time it took to form the signal (bounce or overcome the level). The less time it took, the stronger the signal.
2) If two or more deals were opened near a certain level based on false signals (which did not trigger Take Profit or the nearest target level), then all subsequent signals from this level should be ignored.
3) In a flat, any pair can form a lot of false signals or not form them at all. But in any case, at the first signs of a flat, it is better to stop trading.
4) Trade deals are opened in the time period between the beginning of the European session and until the middle of the American one, when all deals must be closed manually.
5) On the 30-minute TF, using signals from the MACD indicator, you can trade only if there is good volatility and a trend, which is confirmed by a trend line or a trend channel.
6) If two levels are located too close to each other (from 5 to 15 points), then they should be considered as an area of support or resistance.
On the chart:
Support and Resistance Levels are the Levels that serve as targets when buying or selling the pair. You can place Take Profit near these levels.
Red lines are the channels or trend lines that display the current trend and show in which direction it is better to trade now.
The MACD indicator (14,22,3) consists of a histogram and a signal line. When they cross, this is a signal to enter the market. It is recommended to use this indicator in combination with trend lines (channels and trend lines).
Important speeches and reports (always contained in the news calendar) can greatly influence the movement of a currency pair. Therefore, during their exit, it is recommended to trade as carefully as possible or exit the market in order to avoid a sharp price reversal against the previous movement.
Beginners on Forex should remember that not every single trade has to be profitable. The development of a clear strategy and money management are the key to success in trading over a long period of time.
InstaForex analytical reviews will make you fully aware of market trends! Being an InstaForex client, you are provided with a large number of free services for efficient trading.

