 Stay
Stay 
Trading Conditions
Products
Tools


GBP/USD 5M
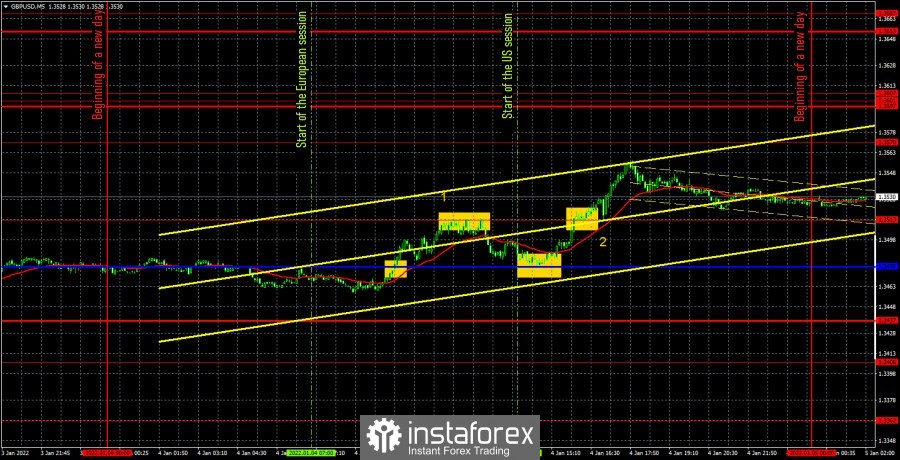
The GBP/USD pair showed a completely different movement than the EUR/USD pair on Tuesday. If there was an outright flat on the euro currency, then it was a rather trendy movement for the pound. However, isn't this the main difference in the pair's movements over the past weeks? The pound is in an upward trend during this period of time, and the euro is in a horizontal channel, so the pairs moved exactly as they should on Tuesday, according to their tendencies. A report on business activity in the manufacturing sector for December was published in the morning in the UK, which turned out to be only slightly higher than forecasted. Thus, it did not provoke any reaction (the number "1" in the chart). The second PMI - US ISM - provoked a slight drop in the dollar in the afternoon. Since the pound/dollar pair did not stand in one place during the day, trading signals for it were much more accurate and profitable. The first buy signal was formed after the price crossed the critical line. Subsequently, the price reached the closest level of 1.3513 and bounced off it. Therefore, it was necessary to close long positions and open short ones here. The profit was about 15 points. The short position also made a profit, as the price dropped to the Kijun-sen line and bounced off it. Another 15 points of profit and a new long position. This time, traders managed to overcome the level of 1.3513, so they had to stay in long positions. And a long position should have been manually closed late in the evening, since we do not recommend postponing deals to the next day, and the pair did not reach the closest level (1.3570). As a result, another 55 points of profit were earned on this deal. Total - 85 points. The pound made it possible to cover losses on the euro/dollar pair and make money from above on Tuesday. This is the difference between flat and trend movement.
We recommend you to familiarize yourself:
Overview of the EUR/USD pair. January 5. 2022 begins with the release of NonFarm Payrolls.
Overview of the GBP/USD pair. January 5. The pound starts the year at its highs, and Boris Johnson rejected the idea of introducing a lockdown.
Forecast and trading signals for EUR/USD for January 5. Detailed analysis of the movement of the pair and trade deals.
GBP/USD 1H
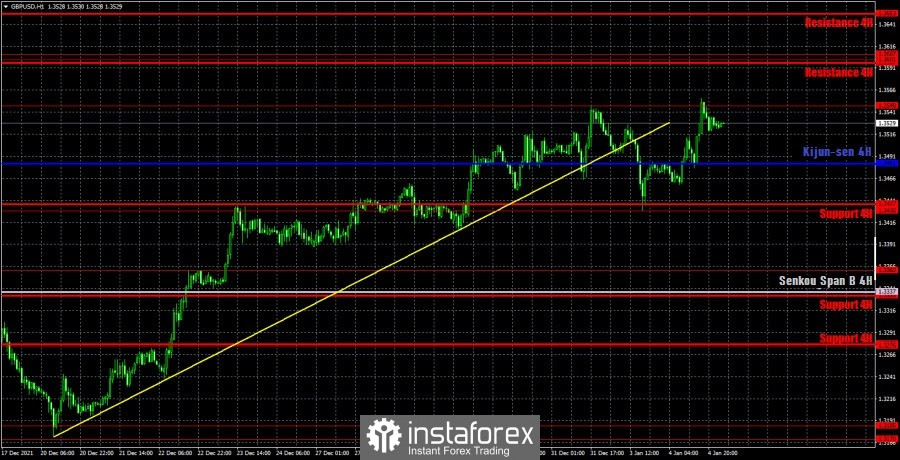
On the hourly timeframe, the pound/dollar pair completed the upward trend, as the price settled below the rising trend line. So the price resumed its upward movement on Monday and Tuesday as if nothing had happened and reached the 1.3548 level once again. However, now we cannot conclude that the upward movement has resumed, since the trend line was still broken. But if the level of 1.3548 is still surpassed, then we can talk about maintaining the upward trend. We highlight the following important levels on January 5: 1.3362, 1.3430, 1.3548, 1.3601-1.3607. The Senkou Span B (1.3337) and Kijun-sen (1.3483) lines can also be signal sources. Signals can be "rebounds" and "breakthroughs" of these levels and lines. It is recommended to set the Stop Loss level to breakeven when the price passes in the right direction by 20 points. The lines of the Ichimoku indicator can move during the day, which should be taken into account when determining trading signals. No important macroeconomic events planned in the UK, and in the US on Wednesday. The Federal Reserve minutes will be published (late in the evening, when all transactions should already be closed) and the ADP report. We believe that the ADP report may provoke a small market reaction, as it remains "thin".
Explanations for the chart:
Support and Resistance Levels are the levels that serve as targets when buying or selling the pair. You can place Take Profit near these levels.
Kijun-sen and Senkou Span B lines are lines of the Ichimoku indicator transferred to the hourly timeframe from the 4-hour one.
Support and resistance areas are areas from which the price has repeatedly rebounded off.
Yellow lines are trend lines, trend channels and any other technical patterns.
Indicator 1 on the COT charts is the size of the net position of each category of traders.
Indicator 2 on the COT charts is the size of the net position for the non-commercial group.
InstaForex analytical reviews will make you fully aware of market trends! Being an InstaForex client, you are provided with a large number of free services for efficient trading.

