 Stay
Stay 
Trading Conditions
Products
Tools


EUR/USD 5M
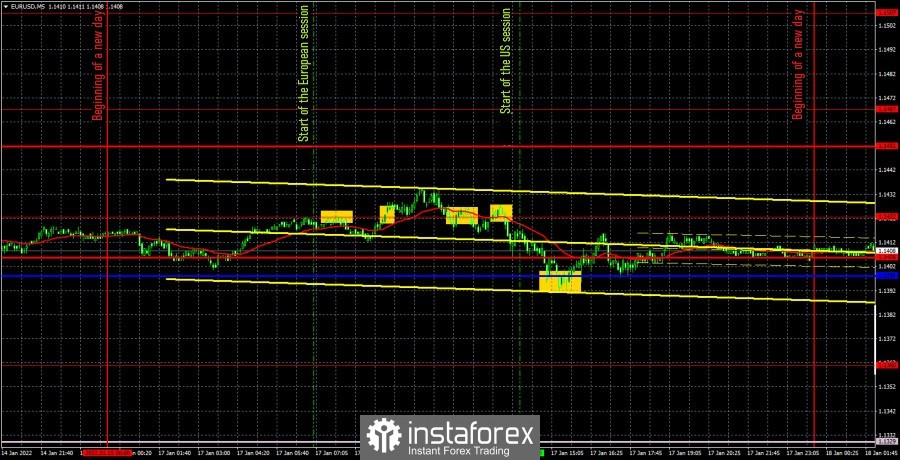
The EUR/USD pair traded poorly for traders on Monday. No important macroeconomic report on this day, no significant fundamental event either in the European Union or in the United States. Moreover, there also won't be any today and tomorrow, so in the first half of the week, traders will be left to themselves. Trading was sluggish in the Asian trading session as usual, but with a slight advantage of the bulls. Bulls tried to build on their success at the European trading session, but were unable to do so due to their own weakness. These sluggish attempts to reverse the emerging new downward trend led to a breakthrough of the extreme level of 1.1422. However, before this happened, the price also managed to rebound from this level. Thus, traders could open both a short position and a long one with the same success during the European trading session. It was possible to earn a maximum of 10 points of profit on these transactions. The bulls began to weaken at the end of the European session, as if showing that last week's upward movement was an accident, not backed up by anything. As a result, by the end of the European session, bears had already come to the forefront and managed to take the pair back below the level of 1.1422, which could be used again to open short positions. The bears were clearly more serious, as the pair managed to show its biggest segment of movement in a day - falling to the critical Kijun-sen line, from which a rebound subsequently occurred. This deal could bring up to 20 points of profit. And the rebound from the critical line could be used to open long positions, but the bulls, having shown nothing in the first half of the day, did not show anything in the second. The movement ended after 10-15 points, and the pair returned to Kijun-sen, which it will try to confidently overcome.
We recommend to familiarize yourself with:
Overview of the EUR/USD pair. January 18. Why does the EU not want to raise the key rate?
Overview of the GBP/USD pair. January 18. The issue of Boris Johnson's resignation for the first time in 2.5 years is on the agenda
Forecast and trading signals for GBP/USD on January 18. Detailed analysis of the movement of the pair and trading transactions.
COT report
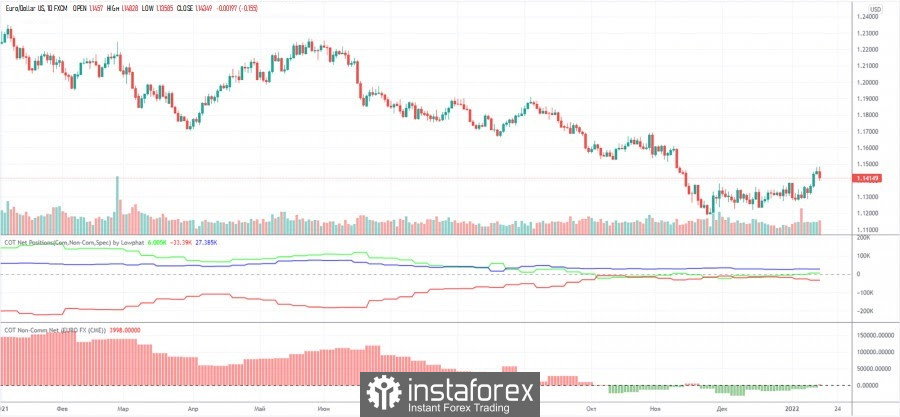
Recent Commitment of Traders (COT) reports have shown that the mood of professional traders is practically unchanged. The green and red lines of the indicators, which indicate the net positions of the most important groups of traders "non-commercial" and "commercial", practically do not move and are near the zero mark. This means that the mood is now as neutral as possible, and the general trend of mood changes still remains downward. Nevertheless, we recall that in most cases the trend movement ends when the red and green lines move away from each other by a considerable distance, which is not the case now. Thus, COT reports now signal that the euro may continue to fall. This coincides with our expectations, as the US fundamentals remain very strong. At the same time, the upward movement in the last week may simply be an "acceleration" in order to cross the important level of 1.1230, which the bears have not been able to overcome for a month and a half.
EUR/USD 1H
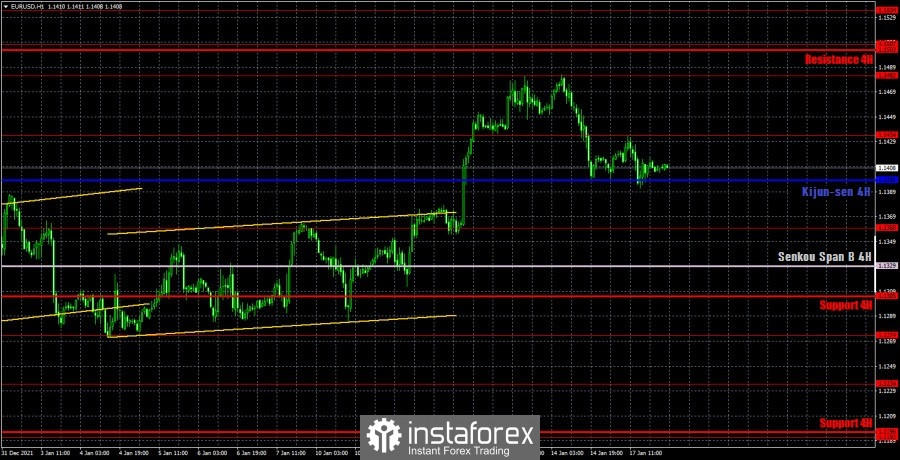
The technical picture on the hourly timeframe remains complex and confusing. On the one hand, a long-awaited trend was formed last week - an upward trend, after a month and a half of flat. On the other hand, the bulls gave up on Friday, and on Monday they could not change anything. So now the euro/dollar pair may continue to fall down to the level of 1.1230. The main thing now is for traders to successfully overcome the critical line. We allocate the following levels for trading on Tuesday – 1.1360, 1.1434, 1.1482, 1.1507, 1.1534, as well as the Senkou Span B (1.1329) and Kijun-sen (1.1398) lines. The lines of the Ichimoku indicator may change their position during the day, which should be taken into account when searching for trading signals. Signals can be "bounces" and "breakthroughs" of these levels and lines. Do not forget about placing a Stop Loss order at breakeven if the price went in the right direction of 15 points. This will protect against possible losses if the signal turns out to be false. Not a single important event is planned in the European Union and the United States on January 18. It is possible to note only the index of sentiment in the business environment from the ZEW Institute, which has a rather modest potential to influence market participants. Thus, we believe that today there may be the same sluggish movement as on Monday, which should be taken into account when working out any trading signals.
Explanations for the chart:
Support and Resistance Levels are the levels that serve as targets when buying or selling the pair. You can place Take Profit near these levels.
Kijun-sen and Senkou Span B lines are lines of the Ichimoku indicator transferred to the hourly timeframe from the 4-hour one.
Support and resistance areas are areas from which the price has repeatedly rebounded off.
Yellow lines are trend lines, trend channels and any other technical patterns.
Indicator 1 on the COT charts is the size of the net position of each category of traders.
Indicator 2 on the COT charts is the size of the net position for the non-commercial group.
InstaForex analytical reviews will make you fully aware of market trends! Being an InstaForex client, you are provided with a large number of free services for efficient trading.

