 Stay
Stay 
Trading Conditions
Products
Tools


GBP/USD 5M
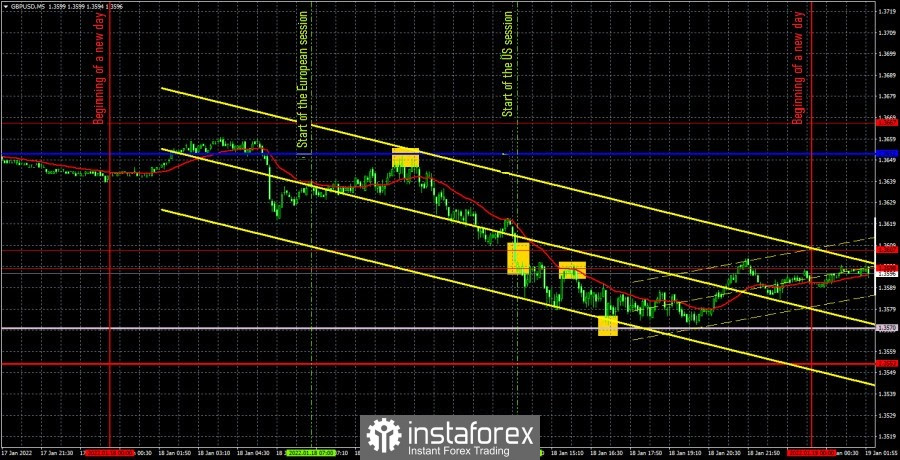
The GBP/USD pair also quickly and sharply restored the downward movement on Tuesday. Recall that just a couple of days ago the price settled below the ascending trend line on the nth attempt. Since the correction for the pound has been brewing for a long time, the pound's succeeding decline had a high chance of implementation. However, unlike the euro/dollar pair, the pound/dollar had a macroeconomic background during the day. As we said yesterday, the reports scheduled for publication in the UK were not the most important, so when it became clear that the markets ignored them, we were not surprised. In short, unemployment in Britain continued to decline, the number of applications for unemployment benefits decreased more than predicted, and wages rose by exactly as much as the market expected. Nevertheless, if the pound received support, it was for a maximum of one hour, during which it managed to add 10 points... Now let's analyze the technical picture and trading signals. A signal similar to the euro currency was formed at night for the pound. The price is not so accurate, but it also bounced off the critical Kijun-sen line, after which a fairly powerful downward movement began. However, it ended quite quickly, and the quotes returned to the critical line. But they returned in order for the bears to start selling on this signal with double force. This time, the price bounced off the critical line almost perfectly in accuracy, so it was necessary to sell the pair here. Throughout the day, the bulls could not oppose anything to the bears, so the pair fell almost nonstop. It easily overcame the area of 1.3598 and 1.3607 levels, after which it fell to the Senkou Span B line, near which it paused. As a result, the overall downward movement was more than 70 points. The movement was almost completely recoilless, which was very convenient for traders. Thus, according to all the signals marked in the chart above, it was possible to make a profit.
We recommend to familiarize yourself with:
Overview of the EUR/USD pair. January 19. Euro found no grounds for continued growth.
Overview of the GBP/USD pair. January 19. No one is interested in the Bank of England, everyone is interested in the resignation of Boris Johnson.
Forecast and trading signals for GBP/USD on January 19. Detailed analysis of the movement of the pair and trading transactions.
COT report
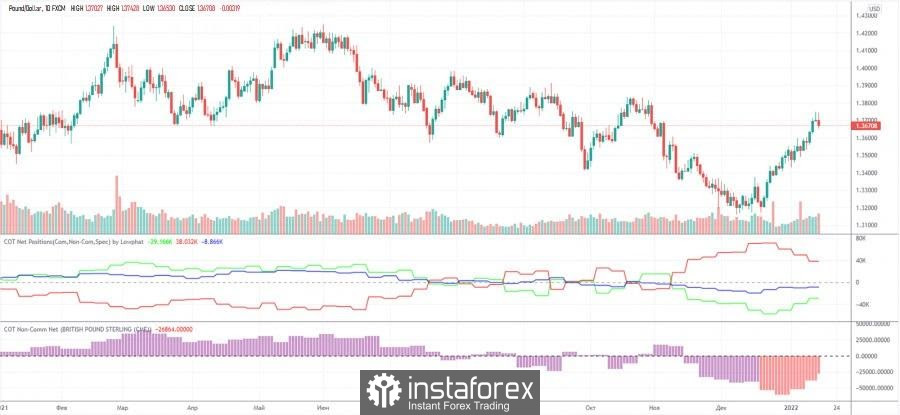
Recall the situation with Commitment of Traders (COT) reports on the euro currency. The picture with the British pound is exactly the opposite. Here, the green and red lines (indicating the net positions of non-commercial and commercial traders) have moved away from each other a couple of weeks ago, which is a signal of the possible end of the trend. That's exactly what happened. At the moment, these lines are converging, so we believe that the upward momentum of the British pound has not been exhausted. The mood of professional traders remains bearish, but at the same time, the trend should be taken into account here. And the trend now is to reduce the difference between the two categories of players. In other words, the bearish mood is weakening. Thus, we believe that after a slight pullback downwards, the growth of the British currency will resume.
GBP/USD 1H
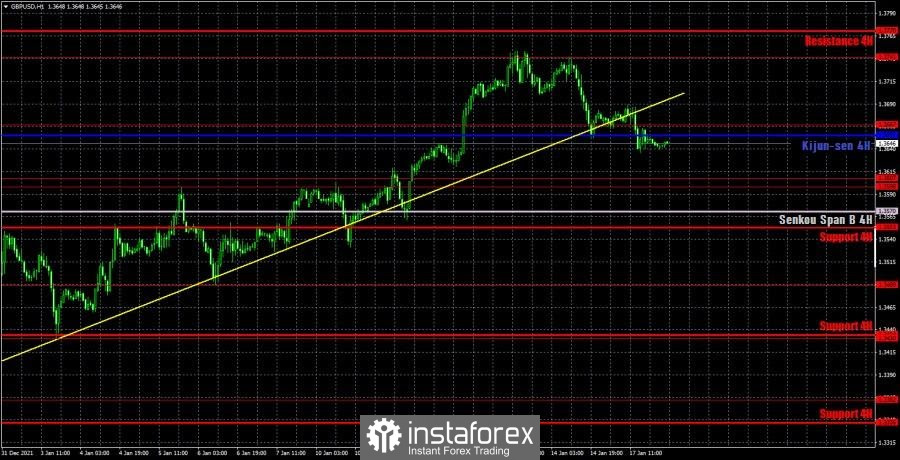
On the hourly timeframe, the pound/dollar pair continues to fall after the ascending trend line was finally overcome. The price also quite easily overcame the Kijun-sen line and is now located near the lower boundary of the Ichimoku cloud of the Senkou Span B. Its breakthrough will signal the continuation of the pound's fall. Recall that this is exactly the option we are counting on. We explained it in more detail in our fundamental articles. We highlight the following important levels on January 19: 1.3489, 1.3598-1.3607, 1.3667, 1.3741. The Senkou Span B (1.3589) and Kijun-sen (1.3660) lines can also be signal sources. Signals can be "bounces" and "breakthroughs" of these levels and lines. It is recommended to set the Stop Loss level to breakeven when the price passes in the right direction by 20 points. The lines of the Ichimoku indicator can move during the day, which should be taken into account when determining trading signals. New publications of macroeconomic indicators are scheduled for Wednesday in the UK. The most important among them is the inflation report for December. All the others are secondary. We believe that this report may be followed by a market reaction, especially if the deviation from the forecast is significant. But at the same time, we remind you that on Friday traders ignored the macroeconomic background and yesterday traders also ignored the macroeconomic background. Therefore, about the same fate may befall the report on British inflation. We believe that the decline of the British currency is highly likely to continue. Moreover, at this time, both main pairs are moving almost synchronously.
Explanations for the chart:
Support and Resistance Levels are the levels that serve as targets when buying or selling the pair. You can place Take Profit near these levels.
Kijun-sen and Senkou Span B lines are lines of the Ichimoku indicator transferred to the hourly timeframe from the 4-hour one.
Support and resistance areas are areas from which the price has repeatedly rebounded off.
Yellow lines are trend lines, trend channels and any other technical patterns.
Indicator 1 on the COT charts is the size of the net position of each category of traders.
Indicator 2 on the COT charts is the size of the net position for the non-commercial group.
InstaForex analytical reviews will make you fully aware of market trends! Being an InstaForex client, you are provided with a large number of free services for efficient trading.

