 Stay
Stay 
Trading Conditions
Products
Tools


EUR/USD 5M
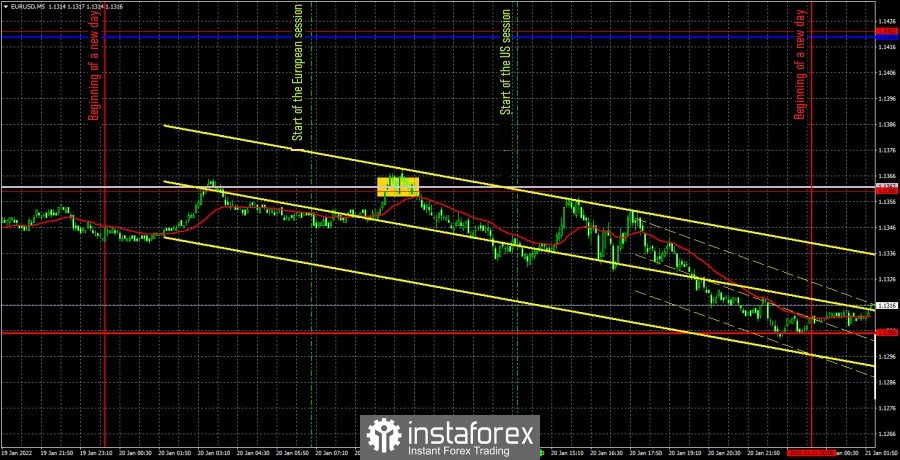
The EUR/USD pair was trading with low volatility and in the absence of an intraday trend movement on Thursday. In principle, this is absolutely not surprising, since there were no important macroeconomic statistics or other fundamental events on Thursday. We said in yesterday's review that reports on European inflation and US unemployment may attract minimal market attention. As it turned out, inflation in the EU, its final estimate for December, did not interest the market at all, and the report on US unemployment unexpectedly showed an increase in the number of applications for the next week to 289,000, despite the fact that in recent months this value did not exceed 230,000. Thus, it should be recognized that the US currency still experienced pressure after the release of this report. However, the dollar's fall was minimal, only 20 points, and within the next hour the pair returned to its original positions. Therefore, the market reaction still followed, but did not affect the general state of things in any way. The euro continues to slide smoothly down and is already in the 1.1274-1.1360 horizontal channel, which it was previously in for a long period of time. Now there is a threat of a new flat, as just yesterday the pair unsuccessfully tried to go above the level of 1.1360. Therefore, the rebound from this level provoked a new downward movement, but inside the horizontal channel. We just have to deal with Thursday's trading signals. There was only one such and it was formed during the European trading session, when the pair bounced from the level of 1.1360, and at the same time from the Senkou Span B line. It was a pretty strong sell signal, so it had to be worked out. Due to the low volatility, the price was able to go down twice by only about 20-30 points and this is the most that traders could get on this deal. Even the price failed to reach the nearest support level of 1.1305.
We recommend to familiarize yourself with:
Overview of the EUR/USD pair. January 21. Large banks are waiting for active action from the Fed.
Overview of the GBP/USD pair. January 21. All coronavirus restrictions are being lifted in the UK.
Forecast and trading signals for GBP/USD on January 21. Detailed analysis of the movement of the pair and trading transactions.
COT report
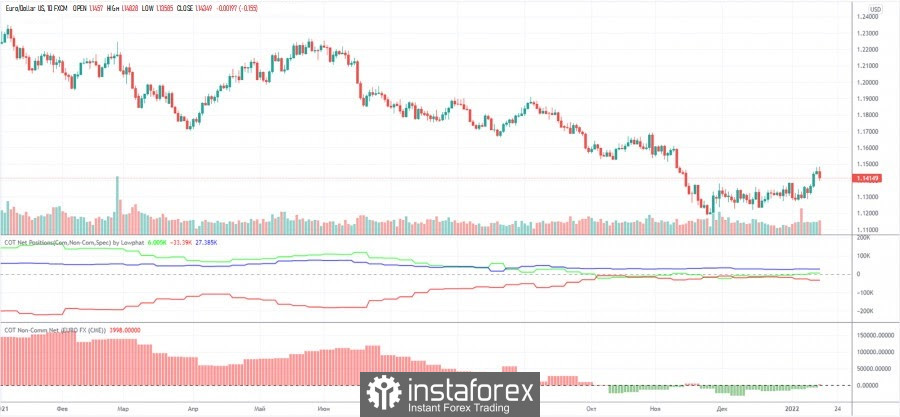
Recent Commitment of Traders (COT) reports have shown that the mood of professional traders is practically unchanged. The green and red lines of the indicators, which indicate the net positions of the most important groups of traders "non-commercial" and "commercial", practically do not move and are near the zero mark. This means that the mood is now as neutral as possible, and the general trend of mood changes still remains downward. Nevertheless, we recall that in most cases the trend movement ends when the red and green lines move away from each other by a considerable distance, which is not the case now. Thus, COT reports now signal that the euro may continue to fall. This coincides with our expectations, as the US fundamentals remain very strong. At the same time, the upward movement in the last week may simply be an "acceleration" in order to cross the important level of 1.1230, which the bears have not been able to overcome for a month and a half.
EUR/USD 1H
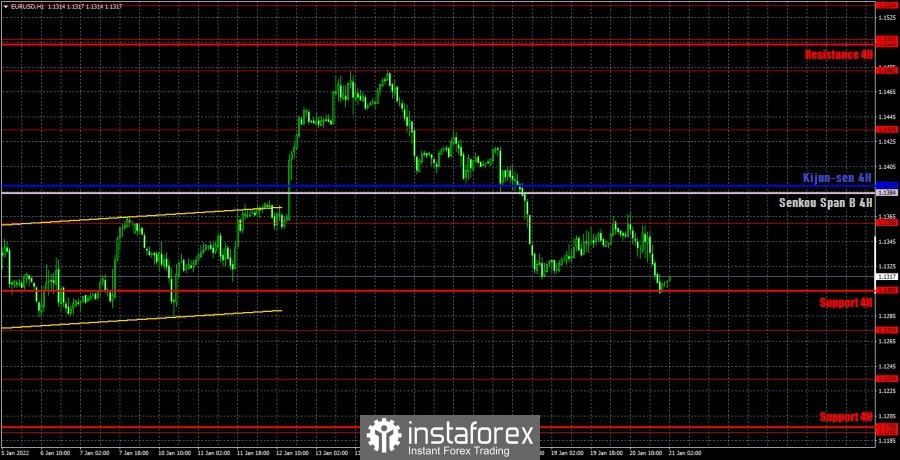
The technical picture remains quite complex on the hourly timeframe. The price returned to the horizontal channel with an upper limit of 1.1360 and a lower limit of 1.1234 (1.1274). Thus, quotes may continue to fall, as the price is now at the top of this channel. At the same time, even if the pair is not going to spend a long time inside it, the fall may still continue, since this is now a more preferable option than the euro's growth, for which there are simply no fundamental grounds. We allocate the following levels for trading on Friday - 1.1234, 1.1274, 1.1360, 1.1434, as well as the Senkou Span B (1.1384) and Kijun-sen (1.1390) lines. The lines of the Ichimoku indicator may change their position during the day, which should be taken into account when searching for trading signals. Signals can be "bounces" and "breakthroughs" of these levels and lines. Do not forget about placing a Stop Loss order at breakeven if the price went in the right direction of 15 points. This will protect against possible losses if the signal turns out to be false. On January 21, European Central Bank President Christine Lagarde will give a speech in the European Union. Her recent speeches did not give any new information to the markets, so we do not expect too much that today will be different. In America, Finance Minister Janet Yellen will make a speech, from which loud comments are not expected now, since all the market's attention is focused on the Federal Reserve.
Explanations for the chart:
Support and Resistance Levels are the levels that serve as targets when buying or selling the pair. You can place Take Profit near these levels.
Kijun-sen and Senkou Span B lines are lines of the Ichimoku indicator transferred to the hourly timeframe from the 4-hour one.
Support and resistance areas are areas from which the price has repeatedly rebounded off.
Yellow lines are trend lines, trend channels and any other technical patterns.
Indicator 1 on the COT charts is the size of the net position of each category of traders.
Indicator 2 on the COT charts is the size of the net position for the non-commercial group.
InstaForex analytical reviews will make you fully aware of market trends! Being an InstaForex client, you are provided with a large number of free services for efficient trading.

