 Stay
Stay 
Trading Conditions
Products
Tools


Yesterday, preliminary data on business activity in Europe, Great Britain, and the United States for January were published.
Statistics details:
Analysis of trading charts from January 24:
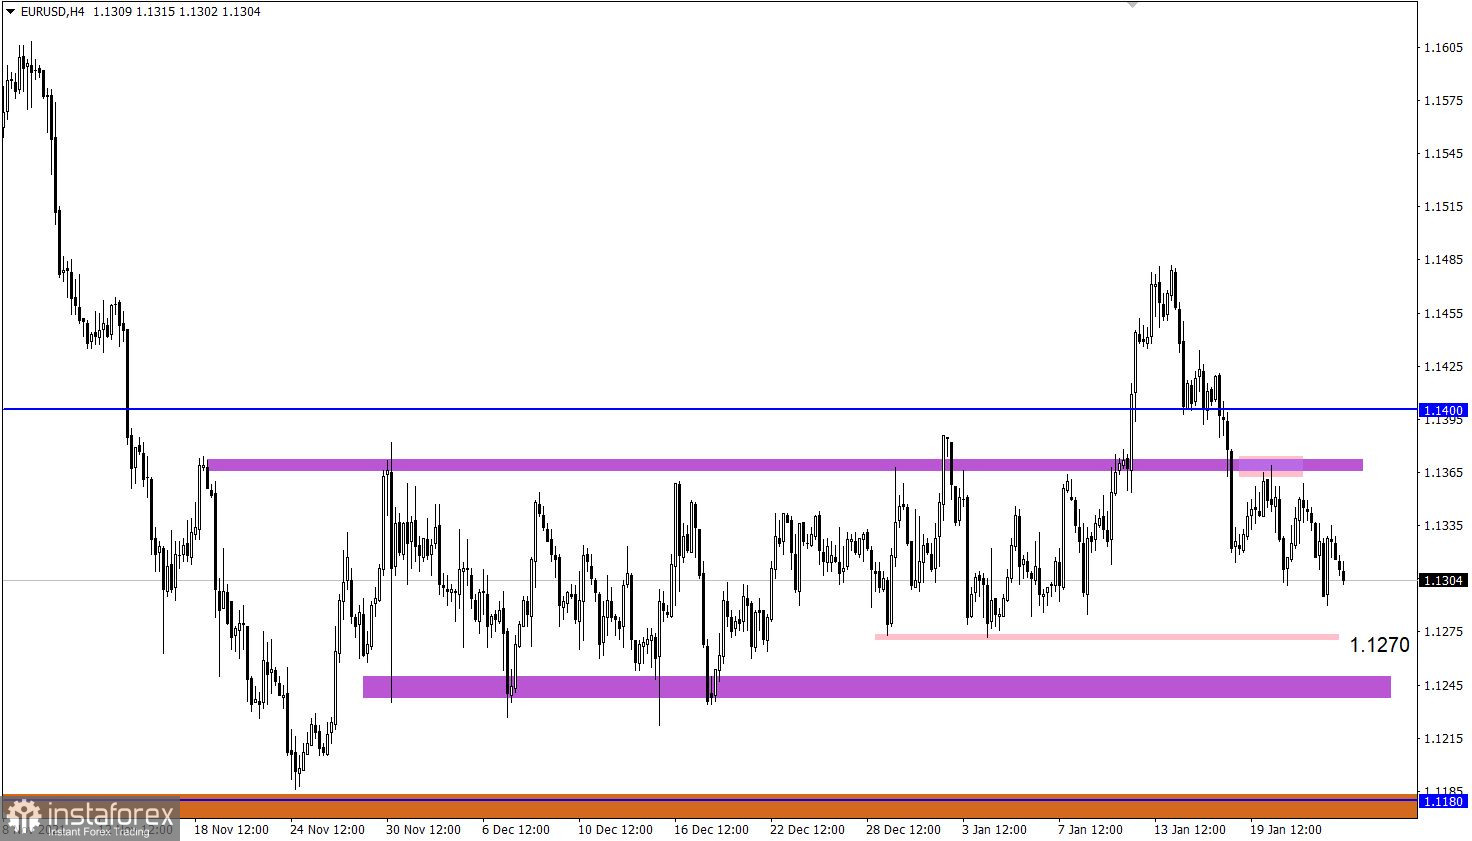
The euro loses more than 170 points in value against the US dollar in one a half weeks. This led to the restoration of the decline in relation to the correction by more than half.
There is a gradual process of restoring dollar positions, which increases the chances of sellers prolonging the downward trend from June last year.
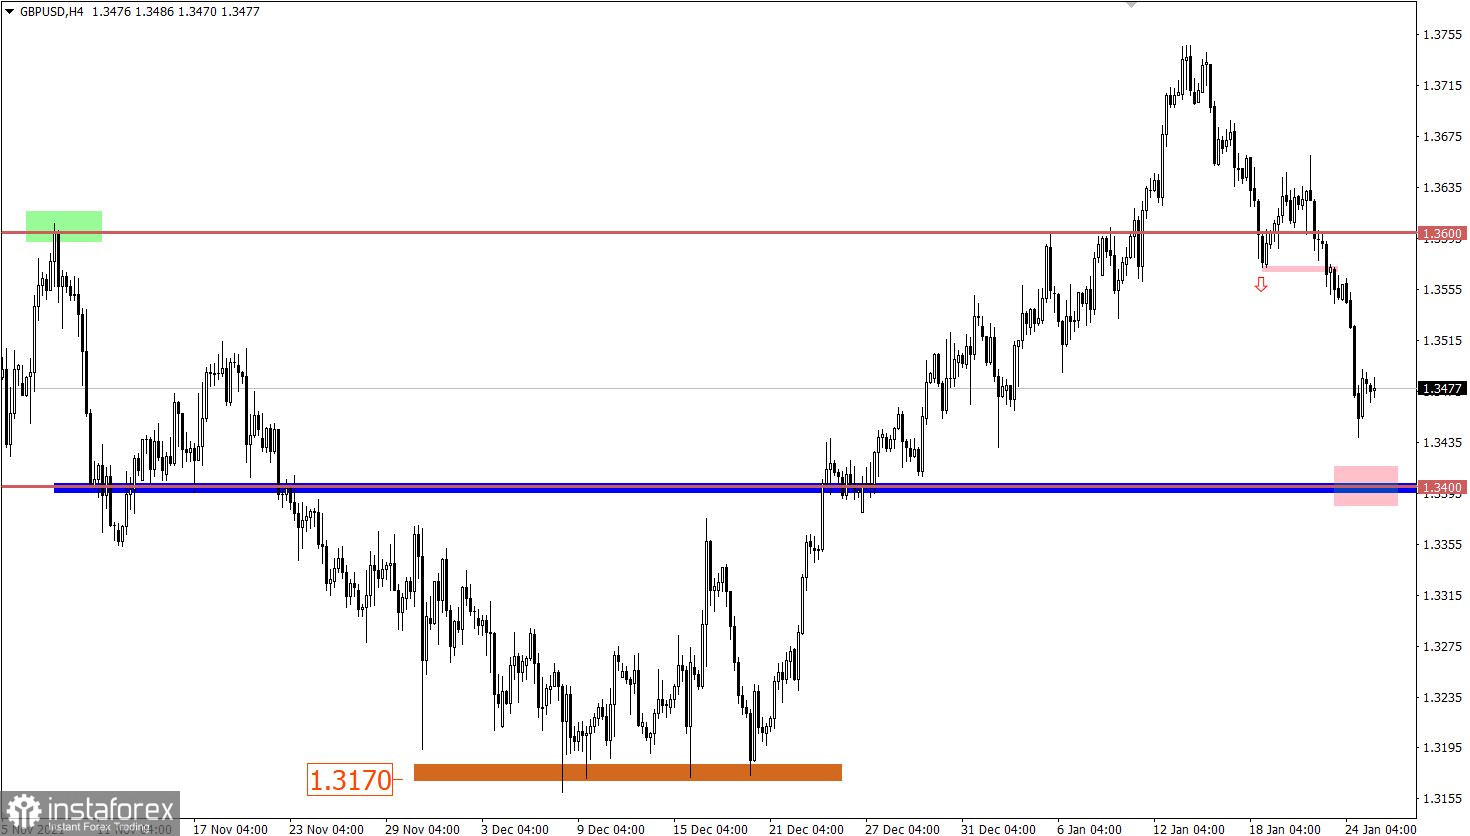
The sharp decline in the GBP/USD pair led to the growth of correction from the local high (1.3747) on January 13. As a result, the overall scale of the pound's weakening amounted to 300 points. This means that the corrective move can be replaced by a recovery move relative to the ascending cycle from December 20 to January 13.

January 25 economic calendar:
Today, the S&P/CS Composite-20 housing cost index in the US will be published, where a slight decline is predicted. This is where the flow of statistical data ends, but it is worth considering that the market will be preparing for the results of the Fed meeting, which will be known on Wednesday evening.
Trading plan for EUR/USD on January 25:
It can be assumed that the downward movement will continue in the market. First of all, this will lead to the price approaching the level of 1.1270, where the reduction in the volume of short positions was observed earlier.
If the pivot point is broken, sellers will rush to the main level of 1.1230.
Trading plan for GBP/USD on January 25:
In this situation, there is a local signal that the pound is oversold in the short term. This may lead to a slowdown in the downward cycle and a technical pullback. In order to prolonged the decline to new price levels, sellers should update yesterday's low first.
What is reflected in the trading charts?
A candlestick chart view is graphical rectangles of white and black light, with sticks on top and bottom. When analyzing each candle in detail, you will see its characteristics of a relative period: the opening price, closing price, and maximum and minimum prices.
Horizontal levels are price coordinates, relative to which a stop or a price reversal may occur. These levels are called support and resistance in the market.
Circles and rectangles are highlighted examples where the price of the story unfolded. This color selection indicates horizontal lines that may put pressure on the quote in the future.
The up/down arrows are the reference points of the possible price direction in the future.
InstaForex analytical reviews will make you fully aware of market trends! Being an InstaForex client, you are provided with a large number of free services for efficient trading.

