empty
 
 
You are about to leave
www.instaforex.eu >
a website operated by
INSTANT TRADING EU LTD
Open Account

27.01.202210:43 Forex Analysis & Reviews: Indicator analysis. Daily review of EUR/USD on January 27, 2022

This information is provided to retail and professional clients as part of marketing communication. It does not contain and should not be construed as containing investment advice or investment recommendation or an offer or solicitation to engage in any transaction or strategy in financial instruments. Past performance is not a guarantee or prediction of future performance. Instant Trading EU Ltd. makes no representation and assumes no liability as to the accuracy or completeness of the information provided, or any loss arising from any investment based on analysis, forecast or other information provided by an employee of the Company or otherwise. Full disclaimer is available here.

Trend analysis (Fig. 1)

The price from the level of 1.1239 (closing of yesterday's daily candle) will make an attempt to continue to decline today in order to test the level of 1.1202 – lower border of the Bollinger line indicator (black dotted line). After this line is reached, the price may start rising to the target of 1.1253 – the pullback level of 14.6% (yellow dotted line).
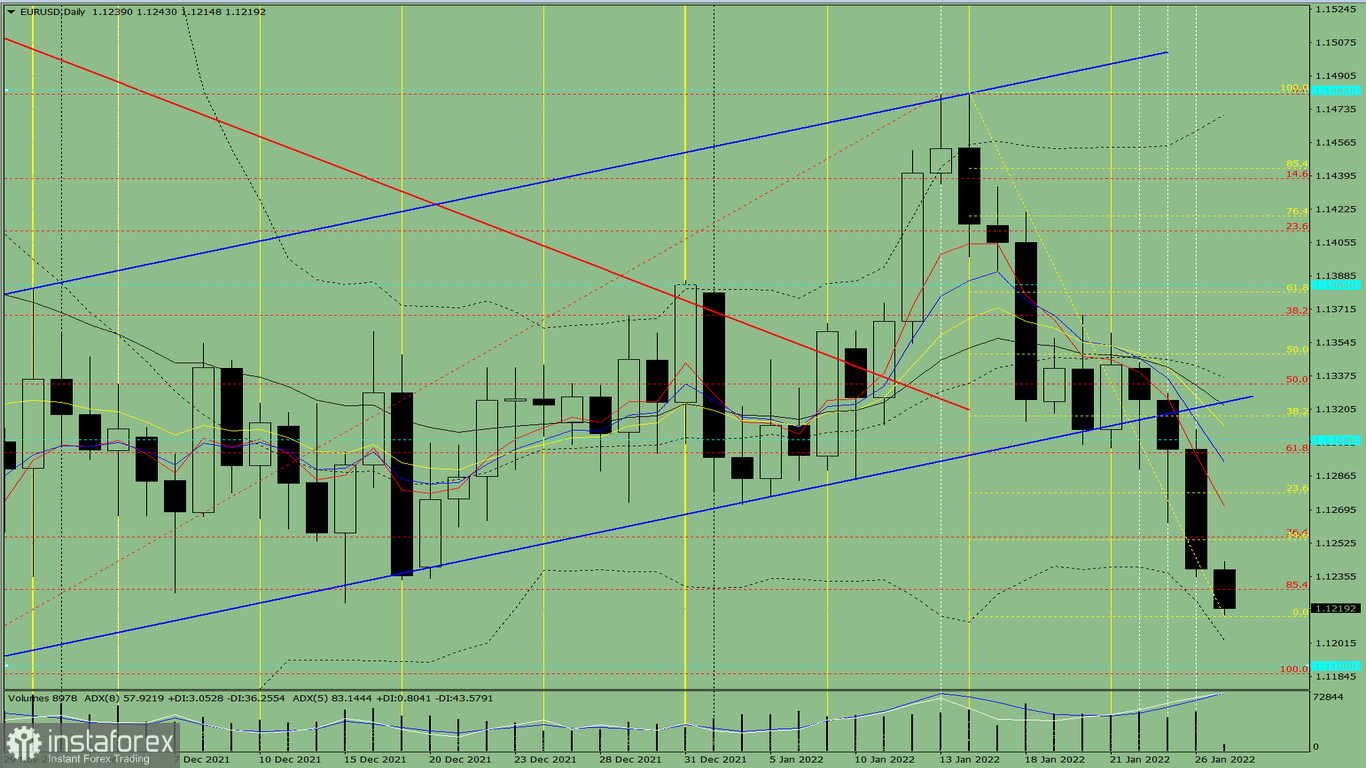
Exchange Rates 27.01.2022 analysis

Fig 1 (daily chart)

Comprehensive analysis:

  • Indicator analysis - down
  • Fibonacci levels - down
  • Volumes - up
  • Candlestick analysis - up
  • Trend analysis - down
  • Bollinger bands - down
  • Weekly chart - down

General conclusion:

Today, the price from the level of 1.1239 (closing of yesterday's daily candle) will try to further fall to be able to test the level of 1.1202 – lower border of the Bollinger line indicator (black dotted line). After reaching it, the price may begin its growth to the target of 1.1253 – the pullback level of 14.6% (yellow dotted line).

Alternatively, the price from the level of 1.1239 (closing of yesterday's daily candle) will attempt to resume its decline in order to test the lower fractal of 1.1186 (red dotted line) and then rise again to the target 1.1254 – the pullback level of 14.6% (yellow dotted line).

Stefan Doll
Analytical expert of InstaForex
© 2007-2024

Open trading account

InstaForex analytical reviews will make you fully aware of market trends! Being an InstaForex client, you are provided with a large number of free services for efficient trading.


You are now leaving www.instaforex.eu, a website operated by INSTANT TRADING EU LTD
Can't speak right now?
Ask your question in the chat.

Turn "Do Not Track" off