 Stay
Stay 
Trading Conditions
Products
Tools


The macroeconomic calendar yesterday was focused on US data, which had an impact on the market.
US GDP grew by a record 6.9% in the fourth quarter against a forecast of 5.5%, while the economy grew 5.7% last year – the highest annual growth rate since 1984.
The US labor market, in the face of data on the volume of applications for unemployment benefits, has slightly increased in the overall indicator, which is not considered good, but, as mentioned earlier, the changes are not big.
The volume of initial applications for benefits decreased from 290 thousand to 260 thousand.
The volume of repeated applications for benefits increased from 1,624 thousand to 1,675 thousand.
The overall figure is +21 thousand.
At the same time, durable goods orders for December fell by 0.9%, which is not considered good for the economy.
The data on GDP was negative, but the US dollar was overbought during the period of publication of the indicators, so it did not lead to a proper reaction in the market.
Analysis of trading charts from January 27:
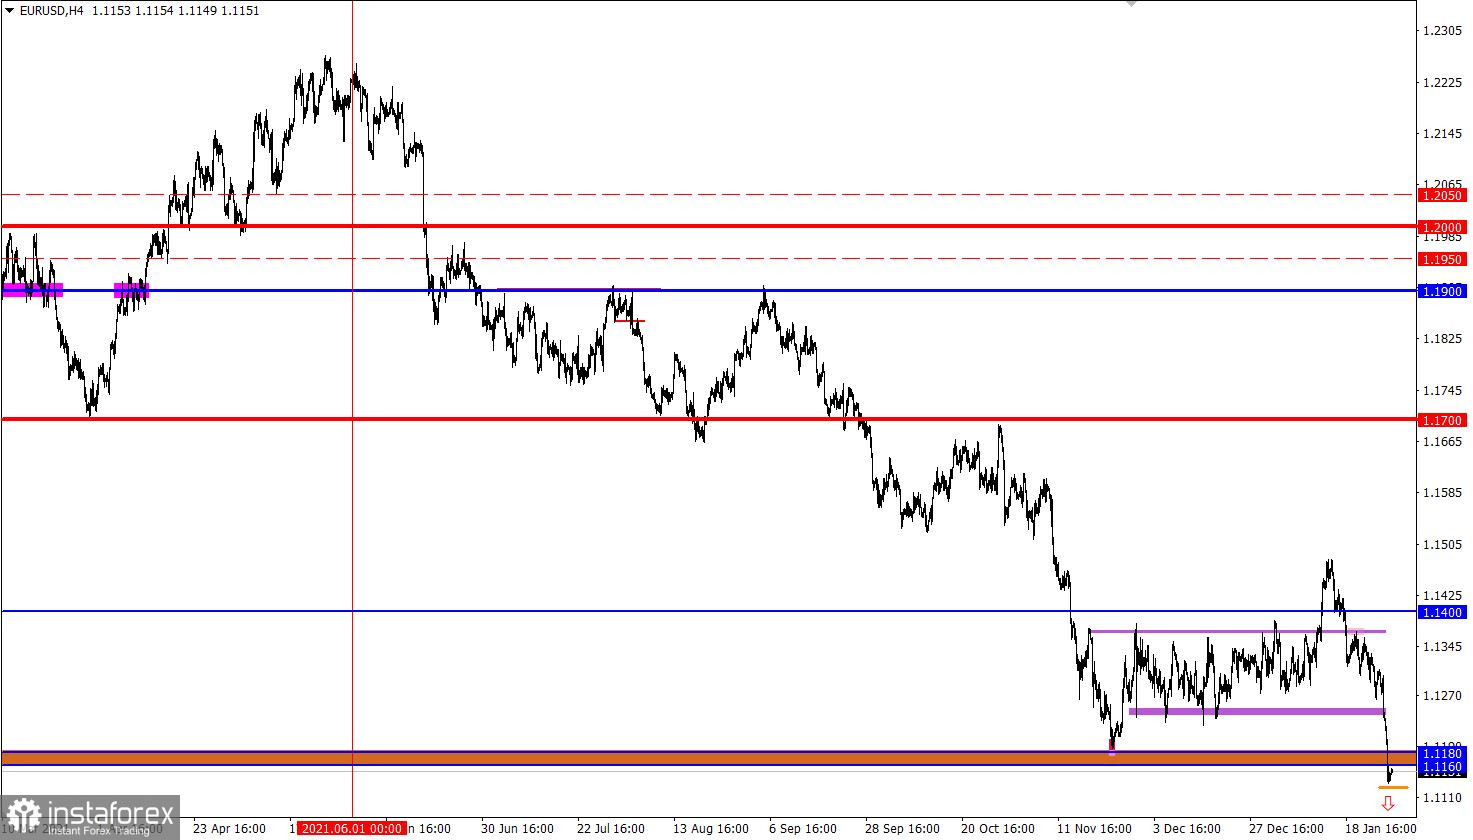
The EUR/USD pair broke through the local low of 2021 (1.1186) during a sharp decline. As a result, a signal was received about the prolongation of the medium-term downward trend, and the quote turned out to be at the levels of June 2020. The overall scale of the euro's weakening for 8 months is 9%.
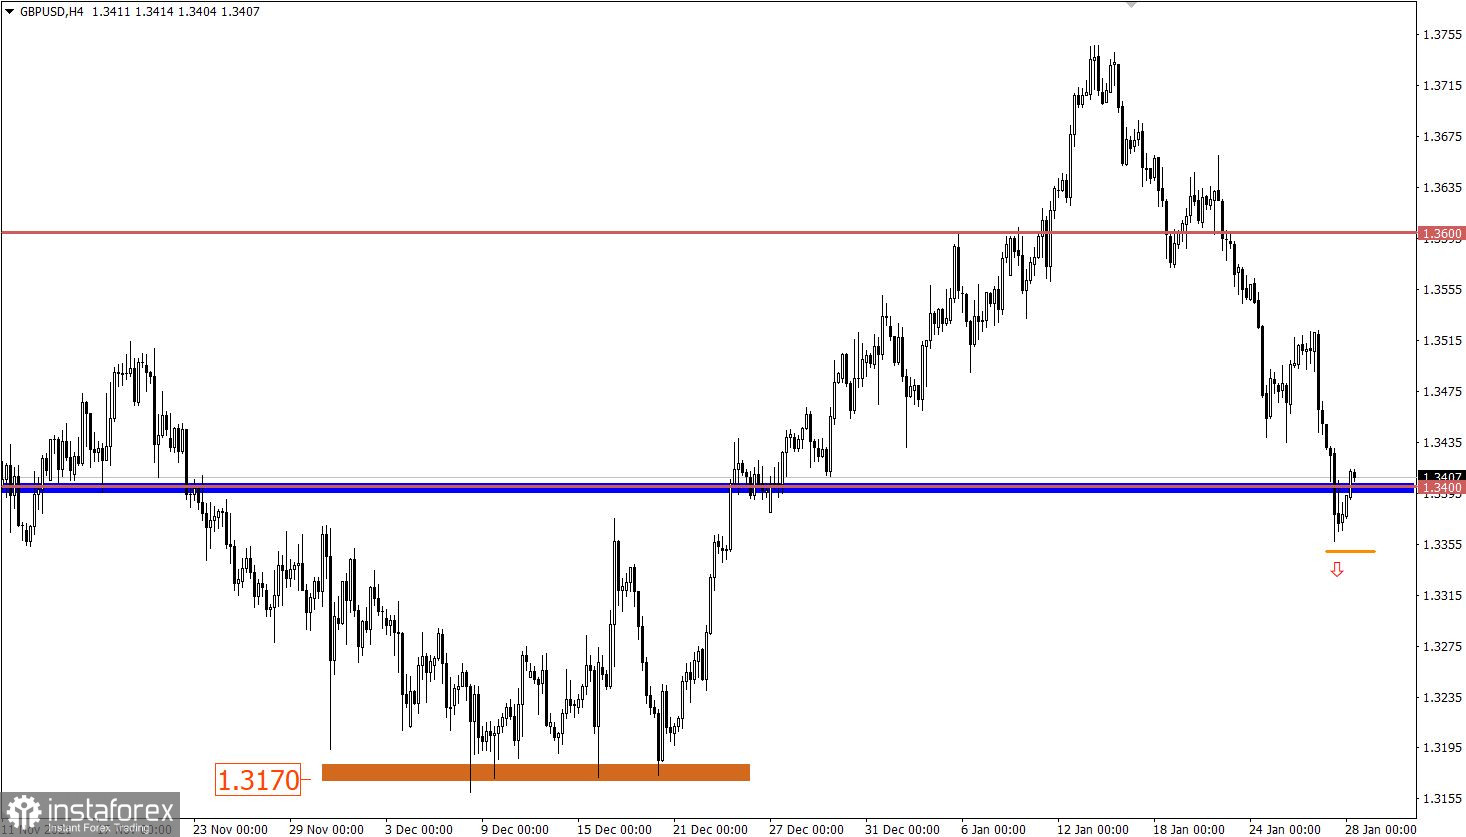
The pound loses 2.7% in value in two weeks against the US dollar. The price change is quite strong, but compared to its European counterpart, the British currency still has room to decline. Yesterday, the support level of 1.3400 was broken, which indicates a high interest in short positions among traders. Before the price is fully restored relative to the ascending cycle, it is necessary to pass another 180 points.

January 28 economic calendar:
Many statistical data from France, Germany, and Italy were published at the opening of European exchanges, but these are only indicators for individual countries. Therefore, they do not affect the market so much.
Eurozone's lending market data will be published at 9:00 Universal time, where no strong changes are predicted.
Thus, today's macroeconomic calendar is quite calm, without particularly important news.
Trading plan for EUR/USD on January 28:
Due to the euro's high oversold level, a technical pullback towards the level of 1.1200 is not ruled out. In this situation, this step will not signal the end of the downward trend, but will only play in favor of the regrouping of trading forces.
The next burst of short positions activity is expected after keeping the price below the level of 1.1130.
Trading plan for GBP/USD on January 28:
In this situation, a pullback will only temporarily delay sellers from weakening the pound further. The downward cycle has been set, which has been confirmed by both technical and fundamental factors. Therefore, keeping the price below the level of 1.3450 is highly likely to lead to a prolongation of the downward cycle towards the local low of December last year.
What is reflected in the trading charts?
A candlestick chart view is graphical rectangles of white and black light, with sticks on top and bottom. When analyzing each candle in detail, you will see its characteristics of a relative period: the opening price, closing price, and maximum and minimum prices.
Horizontal levels are price coordinates, relative to which a stop or a price reversal may occur. These levels are called support and resistance in the market.
Circles and rectangles are highlighted examples where the price of the story unfolded. This color selection indicates horizontal lines that may put pressure on the quote in the future.
The up/down arrows are the reference points of the possible price direction in the future.
InstaForex analytical reviews will make you fully aware of market trends! Being an InstaForex client, you are provided with a large number of free services for efficient trading.


