 Stay
Stay 
Trading Conditions
Products
Tools


Yesterday, the EUR/USD pair was in an upward movement almost throughout the day. We cannot say that the strengthening of the European currency was provoked by a fundamental or macroeconomic background, because, for example, there was not a single important event in the European Union on Wednesday. On the other hand, Federal Reserve Chairman Jerome Powell made a new speech in America, this time before the Senate, he confirmed the central bank's intention to raise the rate as much as needed to achieve price stability. Thus, the chances that the key rate will increase by 0.75% in July continue to grow. And this hawkish information provoked... the fall of the US currency. We have already said in recent articles that the euro can only count on technical growth now. It seems that this is what we continue to observe with only one small assumption. The market has probably decided that a new strengthening of the dollar is inevitable, so now you can push the rate up a bit, so that later you can start selling at higher levels, deceiving the bulls. This is the only logical explanation for what is happening.
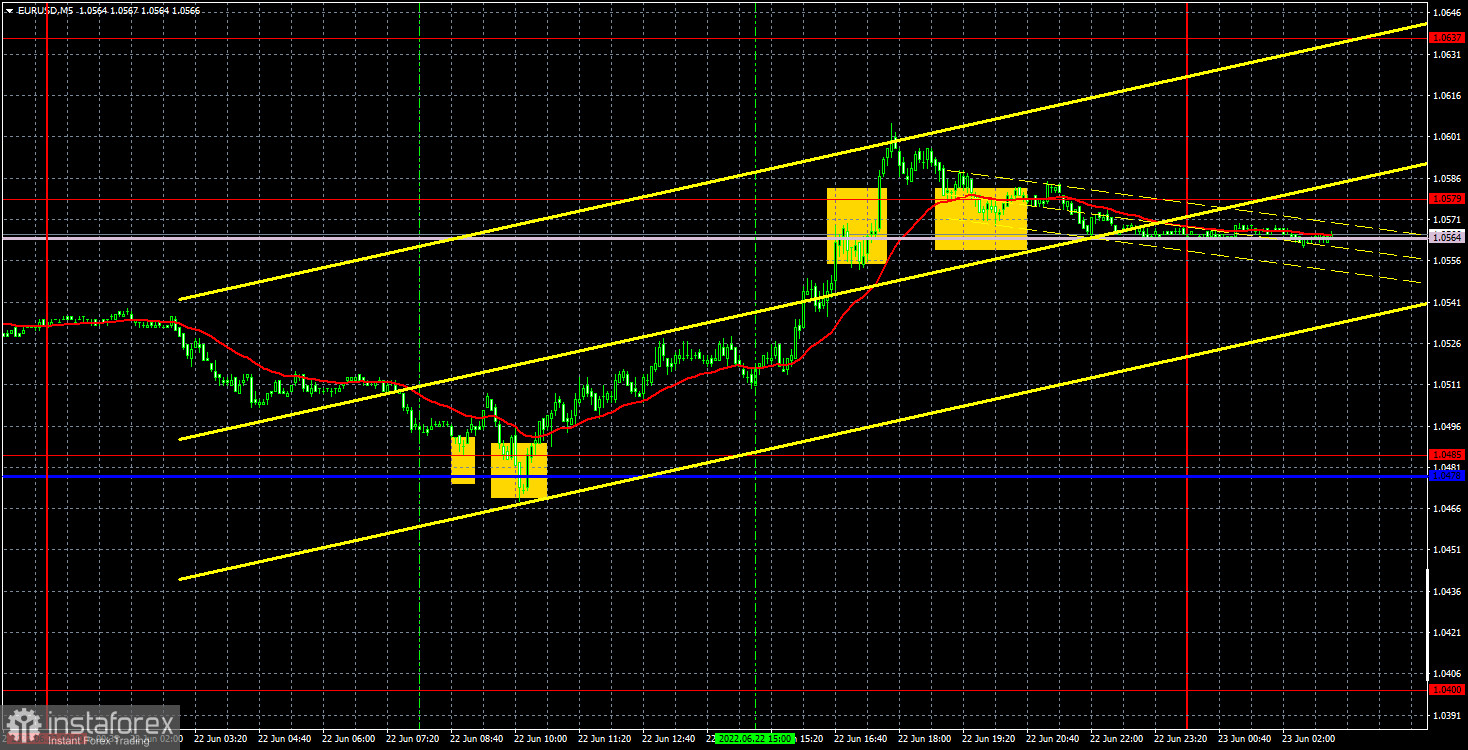
As for trading signals, they were very good. The pair bounced off the Kijun-sen -1.0485 area twice at the very beginning of the European trading session, forming two buy signals. Of course, it was necessary to open only one long position. Subsequently, the pair rose to the Senkou Span B line, then to the level of 1.0579, and then overcame them. It was necessary to close the long position only in the evening, manually, since the sell signal was never formed. As a result, it was possible to make a profit on a single open transaction by about 80 points.
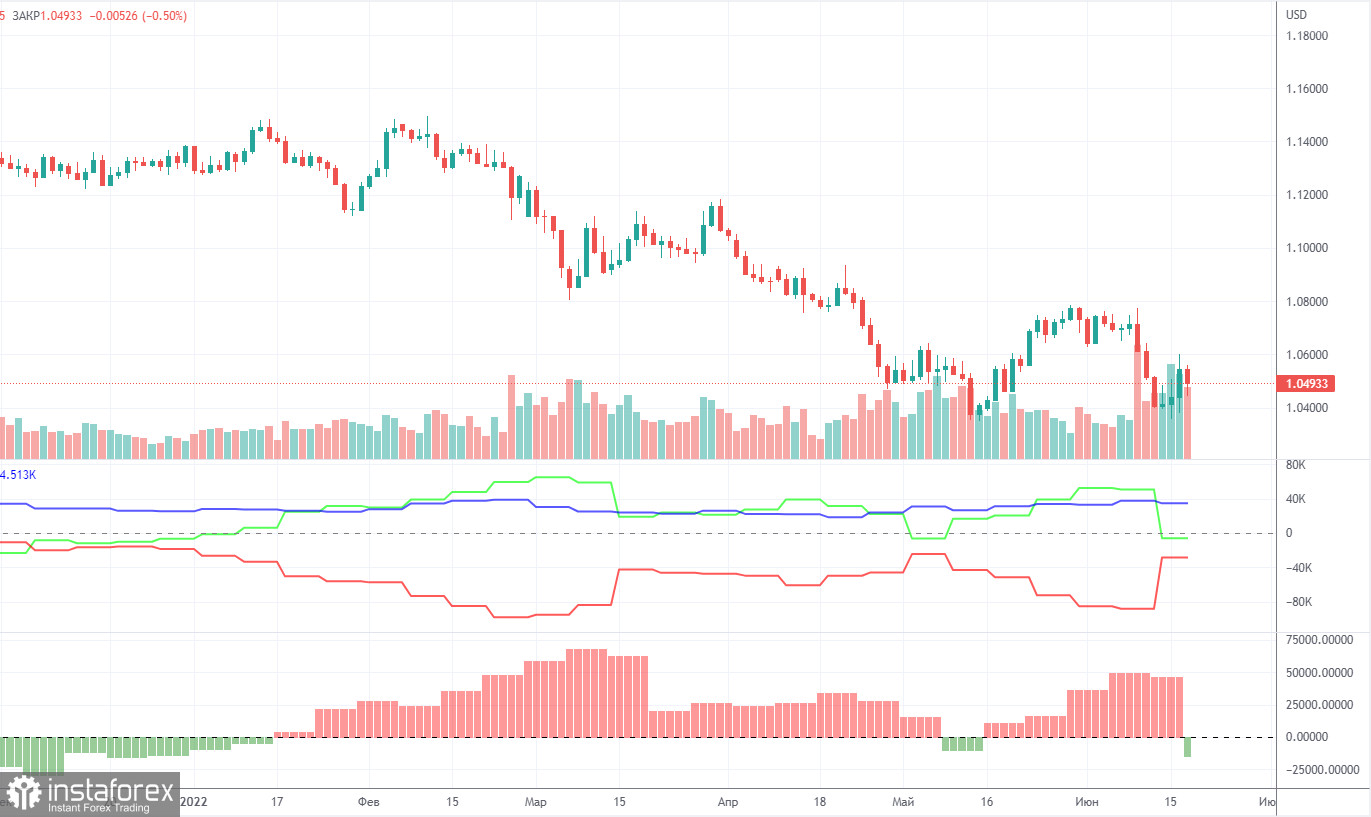
The latest Commitment of Traders (COT) reports on the euro raised a lot of questions. Recall that in the past few months, they showed a blatant bullish mood of professional players, but the euro fell all the time. At this time, the situation is beginning to change, and again, not in favor of the euro. If earlier the mood was bullish, but the euro was falling, now the mood has become bearish... During the reporting week, the number of long positions decreased by 23,200, while the number of shorts in the non-commercial group increased by 33,300. Thus, the net position fell by 56,500 contracts in just a week. From our point of view, this fact very eloquently indicates that now even major players do not believe in the euro. The number of longs is now lower than the number of shorts for non-commercial traders by 6,000. Therefore, we can well expect that now not only the demand for the US dollar will remain strong, but also the demand for the euro will decline. Again, this may lead to an even greater fall in the euro. In principle, over the past few months or even more, the euro has not been able to show even a strong correction, not to mention something more. Its highest upward movement was about 400 points. All fundamental, geopolitical factors remain in favor of the US dollar.
Overview of the EUR/USD pair. June 23. And again geopolitics. The European Union continues to put pressure on Russia.
Overview of the GBP/USD pair. June 23. British inflation: neither here nor there.
Forecast and trading signals for GBP/USD on June 23. Detailed analysis of the movement of the pair and trading transactions.
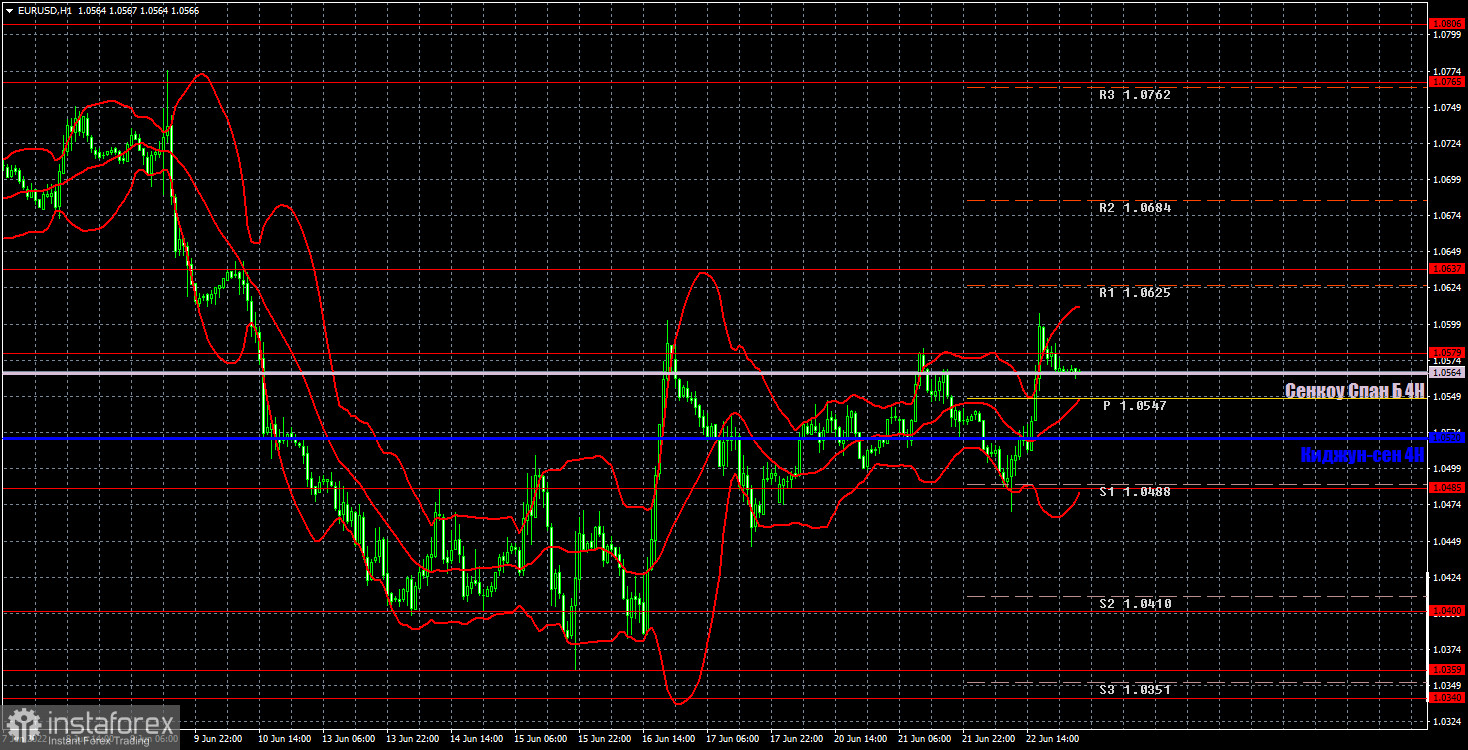
The pair continues to try to continue the upward movement on the hourly timeframe, but it is also clearly visible that it is not doing much. From time to time, the euro shows growth, which is very difficult to explain by fundamental events, but still the feeling that this is just another slight correction, and after its completion, the euro will rush down again. Today, we highlight the following levels for trading - 1.0340-1.0359, 1.0400, 1.0485, 1.0579, 1.0637, as well as Senkou Span B (1.0564) and Kijun-sen (1 .0520). Ichimoku indicator lines can move during the day, which should be taken into account when determining trading signals. There are also secondary support and resistance levels, but no signals are formed near them. Signals can be "rebounds" and "breakthrough" extreme levels and lines. Do not forget about placing a Stop Loss order at breakeven if the price has gone in the right direction for 15 points. This will protect you against possible losses if the signal turns out to be false. Indexes of business activity in the services and manufacturing sectors will be published in Europe and the US. We do not consider these data important in the current circumstances, but still they should not be completely ignored either. Suddenly there will be unexpected values! Also, Powell will deliver another speech in Congress, which, most likely, will completely repeat yesterday's.
Support and Resistance Levels are the levels that serve as targets when buying or selling the pair. You can place Take Profit near these levels.
Kijun-sen and Senkou Span B lines are lines of the Ichimoku indicator transferred to the hourly timeframe from the 4-hour one.
Support and resistance areas are areas from which the price has repeatedly rebounded off.
Yellow lines are trend lines, trend channels and any other technical patterns.
Indicator 1 on the COT charts is the size of the net position of each category of traders.
Indicator 2 on the COT charts is the size of the net position for the non-commercial group.
InstaForex analytical reviews will make you fully aware of market trends! Being an InstaForex client, you are provided with a large number of free services for efficient trading.

