 Stay
Stay 
Trading Conditions
Products
Tools


Trend analysis
In July, GBP/USD will move from 1.2175 (the closing of the June monthly candle) up to 1.2269, which is the 14.6% retracement level (red dotted line). Upon reaching it, the pair will go to the 23.6% retracement level at 1.2477 (red dotted line), then rollback downwards.
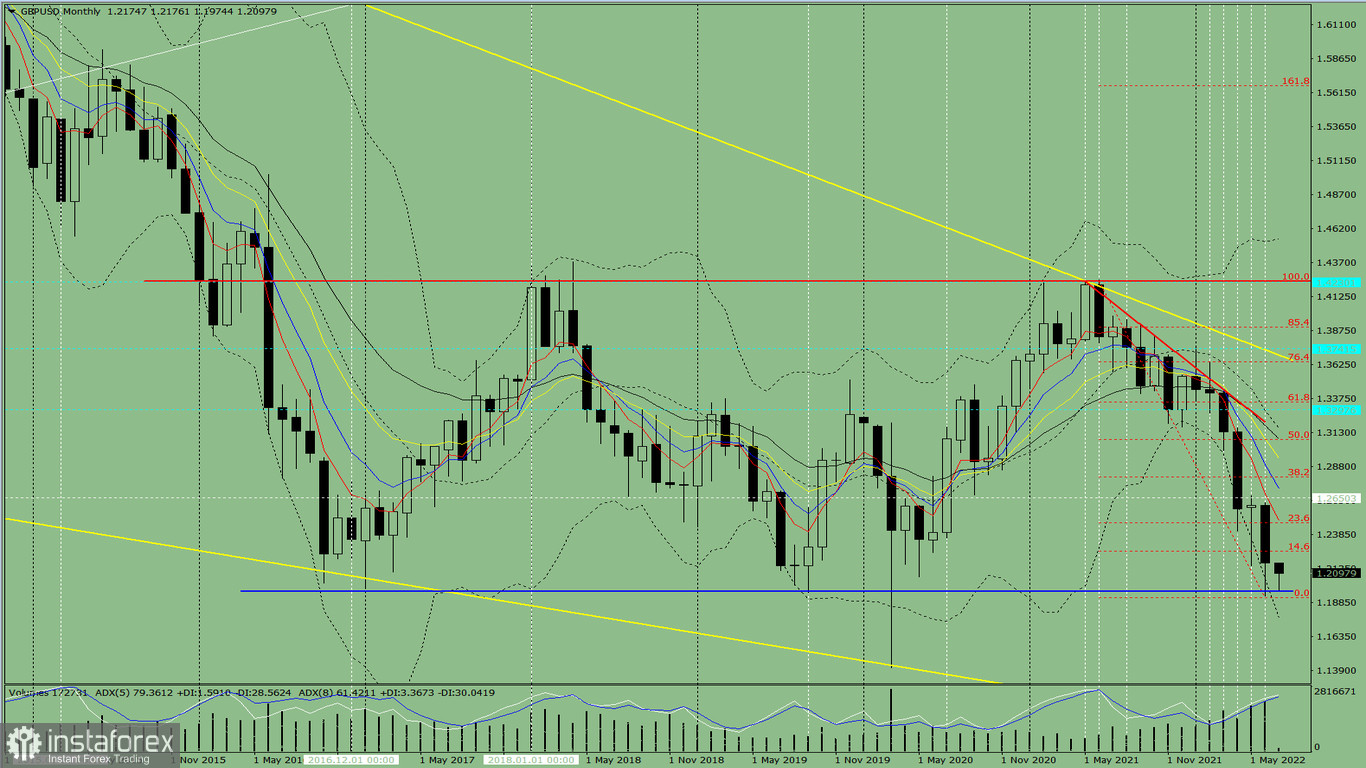
Fig. 1 (monthly chart)
Comprehensive analysis:
Indicator analysis - uptrend
Fibonacci levels - uptrend
Volumes - uptrend
Candlestick analysis - uptrend
Trend analysis - uptrend
Bollinger bands - uptrend
All this points to an upward movement in GBP/USD.
Conclusion: The pair will have an upward trend with no first lower shadow on the monthly white candle (the first week of the month is white) and no second upper shadow (the last week is white).
And throughout the month, the quote will climb from 1.2175 (the closing of the June monthly candle) to the 14.6% retracement level at 1.2269 (red dotted line), go further up to the 23.6% retracement level at 1.2477 (red dotted line), then rollback downwards.
Alternatively, the pair could decrease from 1.2175 (the closing of the June monthly candle) to the lower fractal at 1.1932 (red dotted line), then bounce up to the 14.6% retracement level at 1.2269 (red dotted line).
InstaForex analytical reviews will make you fully aware of market trends! Being an InstaForex client, you are provided with a large number of free services for efficient trading.


